 AI Video Guide
  AI Picture Guide
 AI One Sentence

Keyi Fei, Bingying Lin, Zhongzhou Luo, Yupei Chen, Jin Yuan, Peng Xiao, "Label-free cellular imaging of mouse retina with dual-mode full-field optical coherence tomography," Chin. Opt. Lett. 23, 031701 (2025)
- Chinese Optics Letters
- Vol. 23, Issue 3, 031701 (2025)
Note: This section is automatically generated by AI . The website and platform operators shall not be liable for any commercial or legal consequences arising from your use of AI generated content on this website. Please be aware of this.
Abstract
1. Introduction
The retina is the innermost multilayered structure of the eye comprising a nervous system and a vascular circulatory system[1]. With layers of specific functional cells, the retina converts received light energy into neuronal signals that become perceived visual images in the brain, and any damage or pathological alteration of them may cause serious clinical problems[2]. Visualization and understanding of retinal structures and functions at the cellular level are paramount for early diagnosis and precise treatment of related diseases. To date, using endogenous or artificial fluorophore labeling, retinal tissue imaging with confocal microscopy or multiphoton microscopy[3,4] enables excellent image resolution of cellular retinal features, including retinal ganglion cells (RGCs), retinal pigment epithelium (RPE) cells, and photoreceptors, and elucidates specific structural and functional information of retinal disease models and retinal visual responses. However, the drawbacks are their limited penetration depth, as well as the photobleaching and phototoxicity induced by high incident power and long acquisition time[5].
Non-invasive detection of the back-reflected optical signal from the retina by optical coherence tomography (OCT) provides high-resolution cross-sectional tomographic images of detailed retinal architectural morphology on the level of individual retinal layers, facilitating the diagnosis and evaluation of most retinal diseases[6]. Nevertheless, traditional OCTs use objectives with relatively low numerical apertures (NAs) and narrow light beams to maintain sufficient depth of field[7], which makes it difficult to provide en face cellular retinal images with high lateral resolution. Full-field OCT (FFOCT) is a kind of time-domain en face parallel OCT, which enables up to micron-scale three-dimensional (3D) resolution by utilizing high NA objectives in a Linnik interferometer configuration[8,9]. Different from traditional OCTs, which require transverse scanning of the illumination spots on the tissue surface, FFOCT uses full-field illumination of spatial incoherent light sources, high-speed megapixel cameras as detector arrays, and time-domain phase modulation to obtain en face images perpendicular to the optical axis. FFOCT has been demonstrated for both ex vivo and in vivo cellular imaging of retina[10,11], revealing representative micrometric morphology for most retinal cells. While conventional FFOCT provides only static structural information based on sample refractive index gradients, by collecting and analyzing the temporal variations of the interference signal of FFOCT, a novel method namely dynamic FFOCT (D-FFOCT) has been developed with intrinsic image contrast generated from intracellular metabolic activities, achieving impressive contrast especially in highly dynamic transparent cells[12]. D-FFOCT not only resolves cell morphology at the subcellular level, but its functional imaging nature also shows valuable information related to cell status[13]. The applications of D-FFOCT in retinal tissues, cells, and organoids have shown its great potential in retinal cell classification and cell status evaluation[14–16].
In this study, we customized a high-resolution label-free dual-mode FFOCT system that is capable of acquiring the cellular images of freshly excised retinal tissues with both static and dynamic contrasts. With the dual-mode FFOCT system, imaging experiments have been performed on normal mouse retina tissue through most of its retinal layers, and the complementary information offered by the structural and functional FFOCT images has been thoroughly compared and analyzed. Moreover, given the critical role of RGCs in glaucoma, early detection of RGC pathology is essential for timely intervention[17], and we have explored the extraordinary ability of the dual-mode FFOCT system in qualifying and quantifying RGC status without invasive labeling in early ischaemia/reperfusion (I/R) injured mouse retinal tissues, a model of glaucomatous damage. Our study demonstrates the promising capabilities of dual-mode FFOCT as a novel imaging tool for evaluating cellular retinal morphology and function and detecting early-stage pathologies like glaucoma.
Sign up for Chinese Optics Letters TOC. Get the latest issue of Chinese Optics Letters delivered right to you!Sign up now
2. Materials and Methods
2.1. Customized dual-mode FFOCT setup
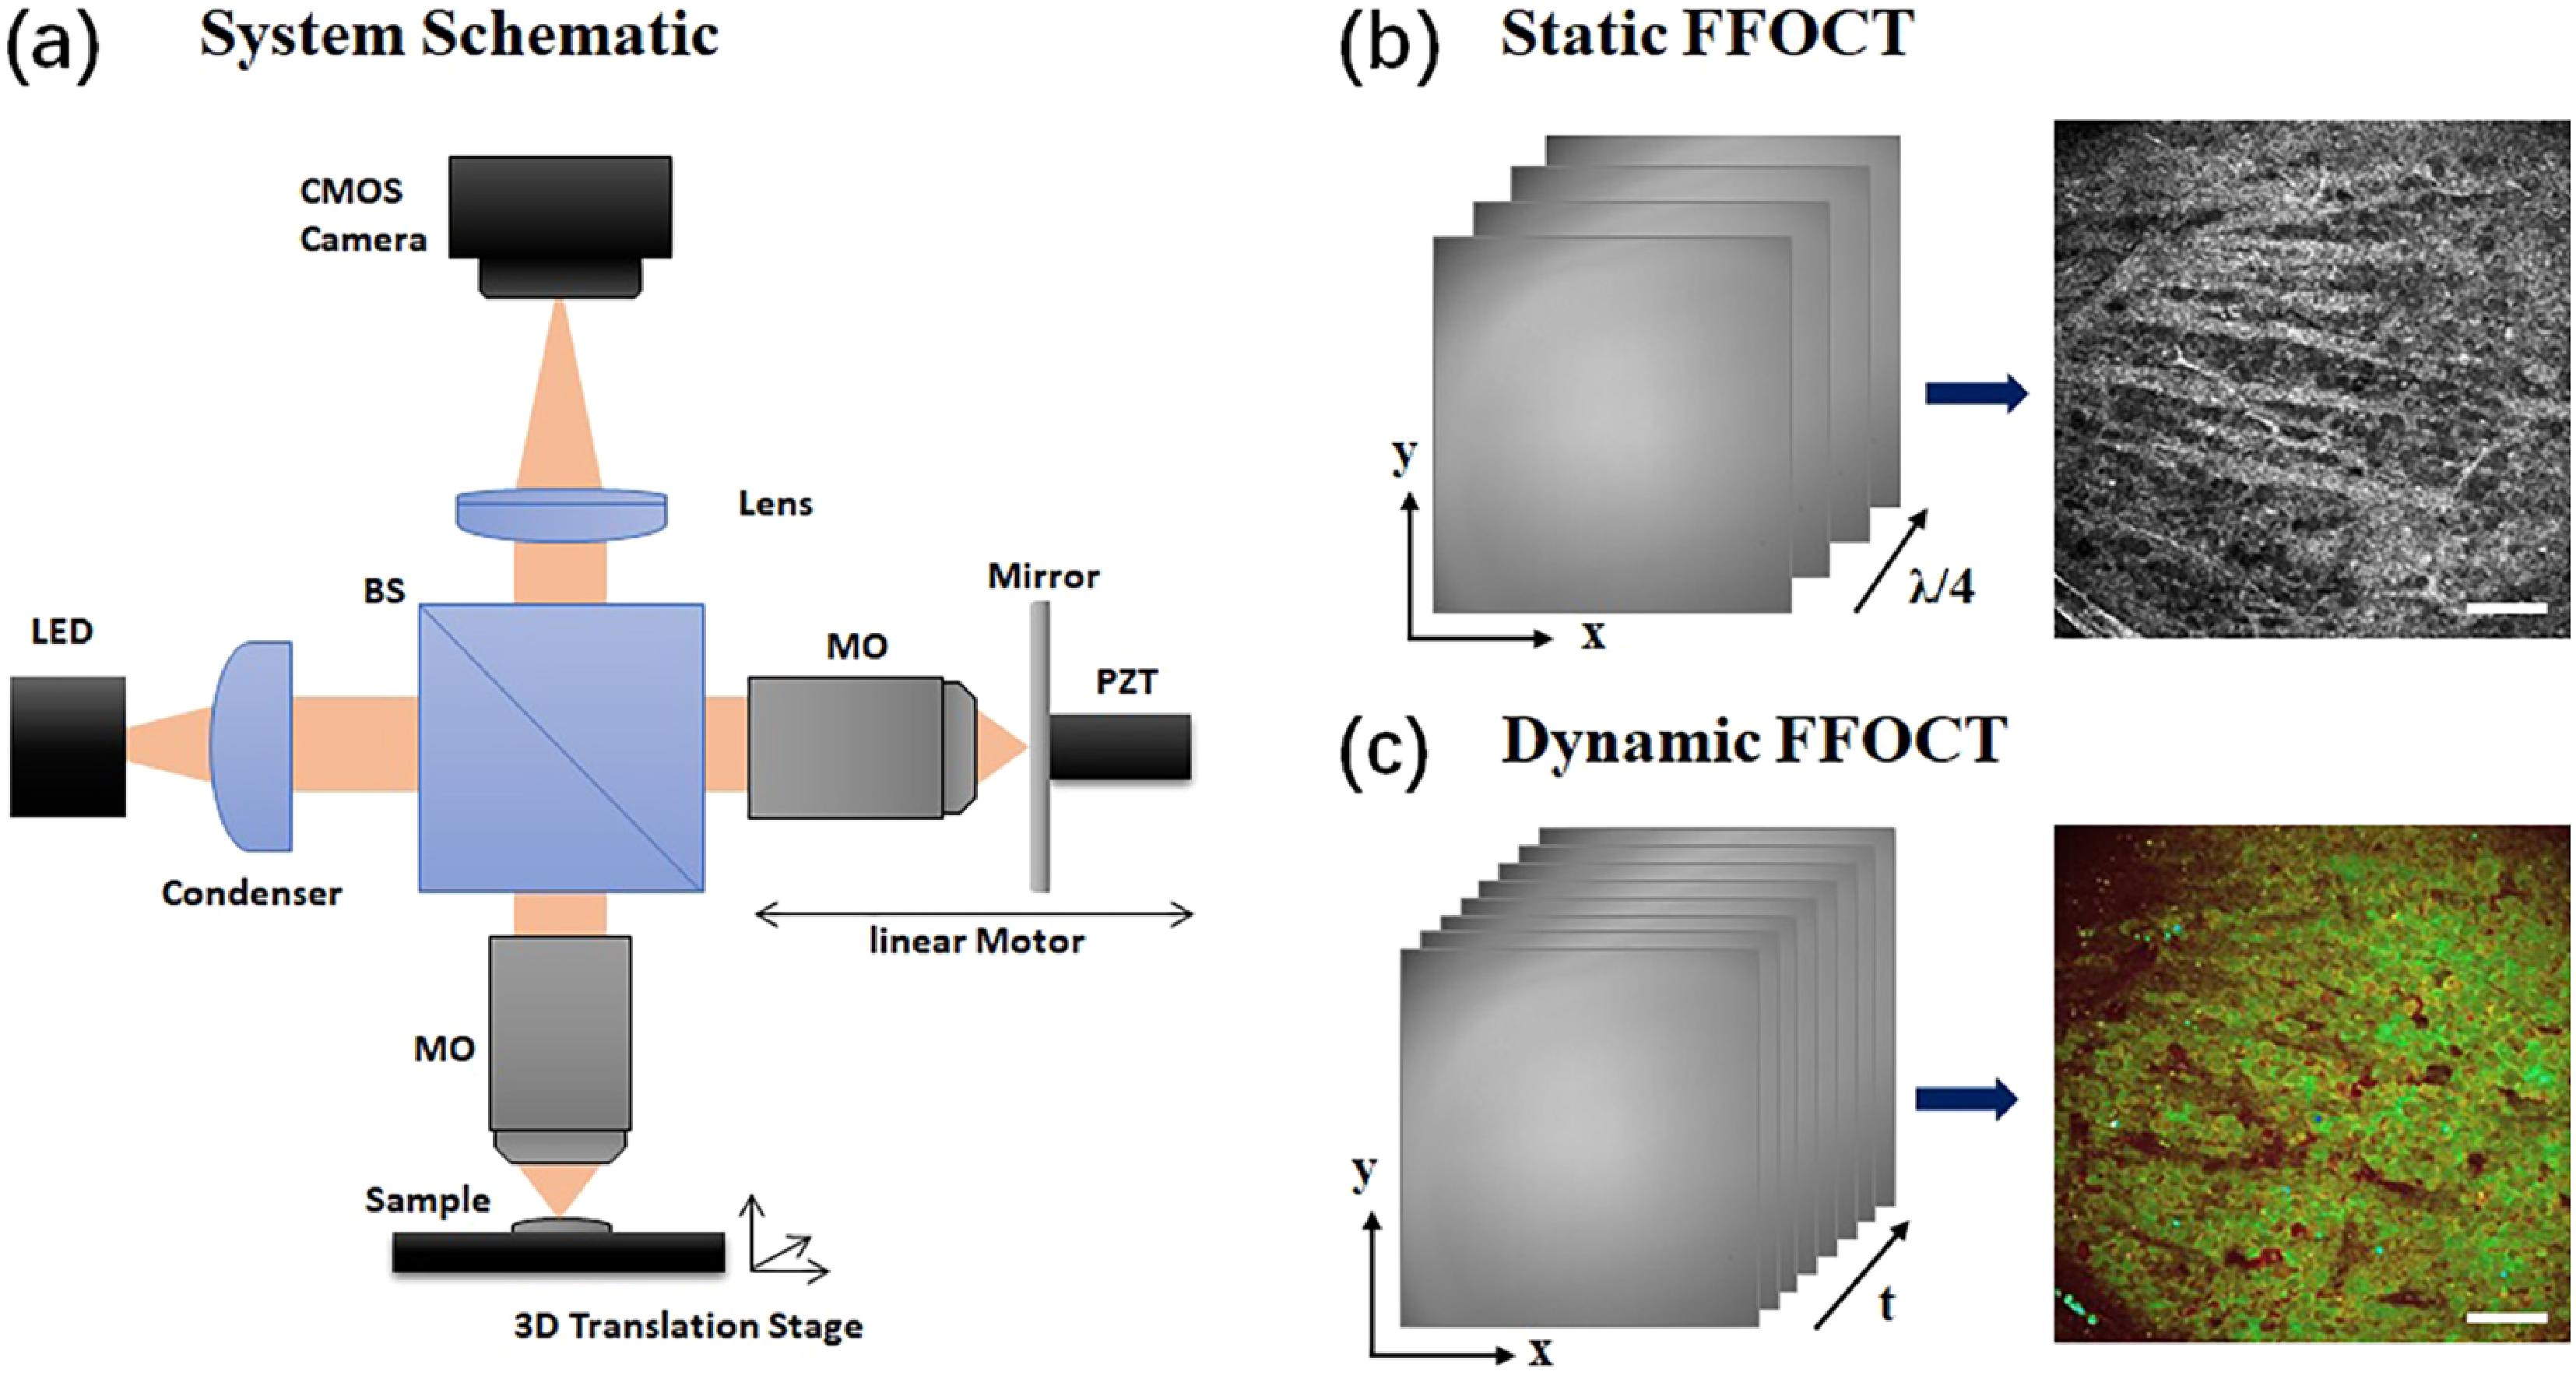
The basic principle of FFOCT is discussed in detail in previous reports[8,9]. Our customized dual-mode FFOCT system, as shown in Fig. 1(a), consists of Linnik interferometry with spatially incoherent LED illumination, which has a central wavelength of 660 nm (M660L3, Thorlabs). The illumination light was divided and directed into two identical high-NA water-immersion microscope objectives (NIR APO
![]()
Figure 1.(a) The optical schematic of our customized dual-mode FFOCT system, (b) static FFOCT image acquired with a 4-phase modulation scheme, and (c) D-FFOCT image extracted through power spectral density analysis color-coding of temporal FFOCT interferograms. BS: beam splitter; LED: light emitting diode; MO: microscope objective; PZT: piezoelectric transducer. Scale bar: 50 µm.
2.2. Retina sample preparation
All animal manipulation was approved by the Institutional Animal Care and Use Committee of Zhongshan Ophthalmic Center, Sun Yat-sen University, and was performed in accordance with the Association for Research in Vision and Ophthalmology Statement for the Use of Animals in Ophthalmic and Vision Research. Male C57BL/6 mice aged 6 to 8 weeks were procured from the Guangzhou Animal Testing Center. The retinal I/R mouse model was prepared as described in detail previously[20]. Before operating, a single intraperitoneal dose of ketamine (100 mg/kg) and xylazine (10 mg/kg) was used to induce anesthesia. The corneas were topically anesthetized with a drop of 0.5% tetracaine, and the pupils were dilated using 1% tropicamide. A 30-gauge needle containing infused sterile saline was used to maintain high intraocular pressure (IOP) of 70 mmHg for 1 h. The needles were carefully withdrawn after 1 h, and tobramycin ointment was used to prevent infection. To visualize the early alterations of RGCs in the I/R injured mouse retinas, the mice were killed 24 h after the model was established. Normal mice were also used for comparison. Fresh retina tissues were excised following eyeball enucleation and then flat-mounted on a glass slide by cutting into four clover leaf shapes.
2.3. Dual-mode FFOCT imaging protocol
To conduct FFOCT imaging, the mouse retinal tissue was gently sandwiched with a coverslip for water-immersed imaging. Dual-mode FFOCT images were taken at every imaging depth of interest sequentially with customized acquisition software developed in Labview. To improve the signal-to-noise ratio of the image, 50 static FFOCT images were acquired and averaged, followed by the acquisition of 500 direct interferograms for D-FFOCT image processing. Thus, the whole acquisition period of one imaging depth is about 7 s. After the completion of dynamic image data acquisition, the power spectrum of each voxel within the image stack was analyzed. Singular value decomposition (SVD) and adaptive threshold filtering were applied to the raw signals to eliminate dynamic artifacts[12]. Fourier transformation was applied to these 3D datasets, followed by computation of different physical parameters using three separate channels of hue, saturation, and value (HSV) to generate 3D color images[16]. The mean frequency was recorded in the hue channel, where the red channel corresponded to low frequencies (0–0.6 Hz), the green channel to mid-frequencies (0.6–5.4 Hz), and the blue channel to high frequencies (5.4–25 Hz). The saturation channel represented the reciprocal of the frequency bandwidth for each voxel. The value channel was computed as the running standard deviation of the moving window of 50 images, which was designed to emphasize the intensity of intracellular motion by capturing variations in pixel values over time. The extraction of each D-FFOCT image from 500 raw interferograms (approximately 2 GB) is computationally intensive. Using an NVIDIA GeForce RTX 4090 GPU with 24G memory, our customized MATLAB code can extract one D-FFOCT image in approximately 25 s. Further qualitative and quantitative analysis of dual-mode FFOCT images was performed using ImageJ software (National Institutes of Health, Bethesda, USA).
2.4. Immunofluorescence imaging protocol
Immunofluorescence imaging experiments of the ganglion cell layer in both normal and early I/R mouse retinas have also been performed for comparison purposes. Mice were euthanized in accordance with ethical guidelines, and whole-body perfusion fixation was performed via the left ventricle using 4% paraformaldehyde. Subsequently, enucleation of the eyeballs, followed by immediate dissection of the retina and preparation of retinal flat mounts, was performed for imaging and analysis. Antibodies targeting Brn3a (1:500; SANTA CRUZ) and TUJ-1 (1:500, Abcam) were employed for specific labeling of RGCs to assess their viability. Image acquisition of retinal specimens was executed using the Leica DM6B fully automatic microscope (Leica, Buffalo, USA), with subsequent image processing conducted using Adobe Photoshop CS8. The quantification of specifically stained RGCs, marked with both red and green, was performed using ImageJ software.
3. Results
3.1. Dual-mode FFOCT imaging of normal mouse retina
Figure 2 shows the paired depth-resolved dual-mode FFOCT images of normal mouse retina through the nerve fiber layer (NFL), ganglion cell layer (GCL), inner plexiform layer (IPL), inner nuclear layer (INL), outer plexiform layer (OPL), and outer nuclear layer (ONL). It is obvious that the grayscale static FFOCT images generated from the refractive index gradients between retinal microscale structures better reveal the relative stationary components like nerve fibers, vascular walls, and plexiform collagens, while the color-coded D-FFOCT images show enhanced contrasts of various cells in different retinal layers with their intracellular metabolic motions highlighted (from red to blue corresponds to slow to fast motilities), offering important complementary information about major retinal layers. Note that the recognition of the major retinal layers and cell types is based on the image stratification as well as the cellular morphology revealed both in static and D-FFOCT images. RPE images are not shown here because the RPE layer is very thin and tightly adherent to the choroid, making it difficult to separate the retina without damaging the RPE layer, thus preventing us from performing effective RPE imaging.
![]()
Figure 2.The depth-resolved static (upper) and dynamic (lower) FFOCT images of normal mouse retina acquired with the dual-mode FFOCT system covering the (a), (b) nerve fiber layer, (c), (d) ganglion cell layer, (e), (f) inner plexiform layer, inner nuclear layer [(g), (h) upper layer; (i), (j) lower layer], outer plexiform layer [upper right corner of (i), (j)], and (k), (l) outer nuclear layer. Scale bar: 50 µm.
In the static image of the NFL [Fig. 2(a)], oriented nerve fiber bundles and twisted capillaries are clearly visible as hyperreflective structures, though the image contrast is slightly affected by the interfering speckles generated from the coverslip-tissue interface. Whereas, in the dynamic image of the NFL [Fig. 2(b)], RGC and amacrine cell somas are well resolved in the spacing between the stable low-signal axon bundles. The densely packed RGCs as well as amacrine cells are better visualized in both the dual-mode FFOCT images of GCL [Figs. 2(c) and 2(d)]. While these cells appear to be low-contrast reflective gray spots in the static image [Fig. 2(c)], their detailed intracellular morphology and motility are revealed unprecedently in the dynamic image [Fig. 2(d)]. Some large and medium ones having heterogeneous shapes and contours, containing abundant cytoplasm, with mostly an eccentric nucleus and obvious nucleolus are believed to be RGCs[21]. The small cell somas are almost entirely occupied by a nucleus but scant cytoplasm may correspond to displaced amacrine cells, whose nuclear-to-cytoplasmic ratio is believed to be greater than RGCs[20]. The cell density in the FFOCT images of GCL is calculated to be
3.2. GCL imaging of I/R injured mouse retina
Figure 3 shows the static and D-FFOCT images of the GCL acquired from the early I/R injured mouse retina [Figs. 3(a) and 3(b)]. While the distribution of the RGCs and amacrine cells is revealed in both images, their detailed appearances are significantly altered compared to the FFOCT images of the GCL in normal mouse retina [Figs. 3(d) and 3(e)]. As shown in the static FFOCT image [Fig. 3(a)], the cell boundaries become unclear although the nucleus is mostly well resolved. There are obvious contrast differences between the nuclear and cytoplasmic regions, with the cytoplasmic region being more reflective than the dark nuclear region, especially in those with richer cytoplasm. The morphological and functional alterations of these cells are better manifested in its D-FFOCT image [Fig. 3(b)], with most of the resolved cells appearing to be squashed and flatten, which should be resulted from the high IOP during the I/R modeling. The D-FFOCT image of the GCL in I/R mouse retina turns to be reddish with reduced brightness when compared to the D-FFOCT image in normal mouse retina GCL, indicating the interference signals shifts to lower frequencies with damped variation amplitudes, which might be caused by the suppression of the intrinsic natural dynamics and metabolic inside the GCL after the I/R modeling. Nevertheless, no significant alterations were found in immunofluorescent staining images between the two groups [Figs. 3(c) and 3(f)]. Both images revealed a similar distribution of RGCs/amacrine cells as well as little axonal staining of retinal neurons in early I/R injured mouse retina [Fig. 3(c)] and normal mouse retina [Fig. 3(f)].
![]()
Figure 3.Dual-mode FFOCT images and the corresponding immunofluorescence images of the GCL acquired in early I/R injured mouse retinal tissue (upper) compared to normal mouse retinal tissue (lower). Scale bar: 50 µm.
3.3. Other representative dual-mode FFOCT images of the NFL and optic disk in normal mouse retina
Figures 4(a) and 4(b) illustrate dual-mode FFOCT images of the NFL in the central region between the fovea and optic disk of the normal mouse retina, where the NFL is thick and fully covers the underlying neuronal cells. In its static FFOCT image [Fig. 4(a)], the nerve fibers show high reflectivity with a vessel brunch passing through. Notably, nerve fibers do not exhibit active functional signals in the D-FFOCT images [Fig. 4(b)]. At the optic disk area, the retinal blood vessel walls exhibit high reflectance in the static image [Fig. 4(c)], while in the dynamic image [Fig. 4(d)], donut-shaped red blood cells are highlighted within the vessels demonstrating high functional activity.
![]()
Figure 4.Dual-mode FFOCT image NFL in the nasal side and the vessels in the optic disk area. Scale bar: 50 µm.
4. Conclusion
In conclusion, we successfully customized a label-free dual-mode FFOCT technique based on Linnik interferometry and applied it for cellular structural and functional imaging of normal and early I/R injured mouse retinas. The uniqueness of dual-mode FFOCT for retinal imaging lies in its dual modes: the static mode presents structural contrasts in the sample through refractive index gradients, while the dynamic mode, without the need for fluorescent dyes, provides color-coded functional contrasts by capturing endogenous cellular motion. Experimental results demonstrate the exceptional capability of static FFOCT images in depicting relatively stationary structures such as nerve fibers, vascular walls, and collagen, offering clear and comprehensive information for anatomical analysis. Conversely, D-FFOCT images excel in enhancing the contrast of various cells by capturing inherent cellular motion, providing a crucial perspective on dynamic cellular activity. Specifically, with dual-mode FFOCT images, we have explored and quantified the cellular changes of RGCs in early I/R injured mouse retinas, a glaucomatous damage model. The combination of these two modes furnishes a comprehensive evaluation of both the structural and functional aspects of RGCs, showing alterations of RGCs in a very early stage. The dual-mode FFOCT system could be a straightforward promising technique for cellular imaging exploration of retinal morphology and function and detecting early-stage pathologies, which is crucial for developing timely diagnosis and monitoring the efficacy of therapeutic strategies, ultimately improving patient outcomes in retinal diseases in which early detection is the key.
While these findings are promising, a more comprehensive understanding of the underlying mechanisms of the D-FFOCT signal is necessary. Additionally, the technique’s sensitivity and specificity for early detection of retinal diseases like glaucoma require further validation in larger cohorts. Nevertheless, the dual-mode FFOCT system presents a significant advancement in retinal imaging, offering a valuable tool for both basic research and clinical applications. Future studies should focus on correlating the D-FFOCT signal with specific cellular metabolic activities and exploring the system’s potential for real-time monitoring of retinal function.
References
[1] J. E. Dowling. The Retina: An Approachable Part of the Brain(1987).
[7] J. M. Schmitt, A. R. Knuettel, A. H. Gandjbakhche et al. Optical characterization of dense tissues using low-coherence interferometry. Holography, Interferometry, and Optical Pattern Recognition in Biomedicine III, 197(1993).


Set citation alerts for the article
Please enter your email address

© Copyright 2018-2021 | Chinese Laser Press. All Rights Reserved 沪ICP备15018463号-20