
Zhaojin LUO, Chengfeng LIU, Wenbao JIA, Qing SHAN, Chao SHI, Jiandong ZHANG, Daqian HEI, Xiaojun ZHANG, Yongsheng LING. Complete coverage path planning of nuclear radiation field using bio-inspired neural network[J]. Journal of Radiation Research and Radiation Processing, 2024, 42(1): 010601
Journals >Journal of Radiation Research and Radiation Processing >Volume 42 >Issue 1 >Page 010601 > Article
- Journal of Radiation Research and Radiation Processing
- Vol. 42, Issue 1, 010601 (2024)
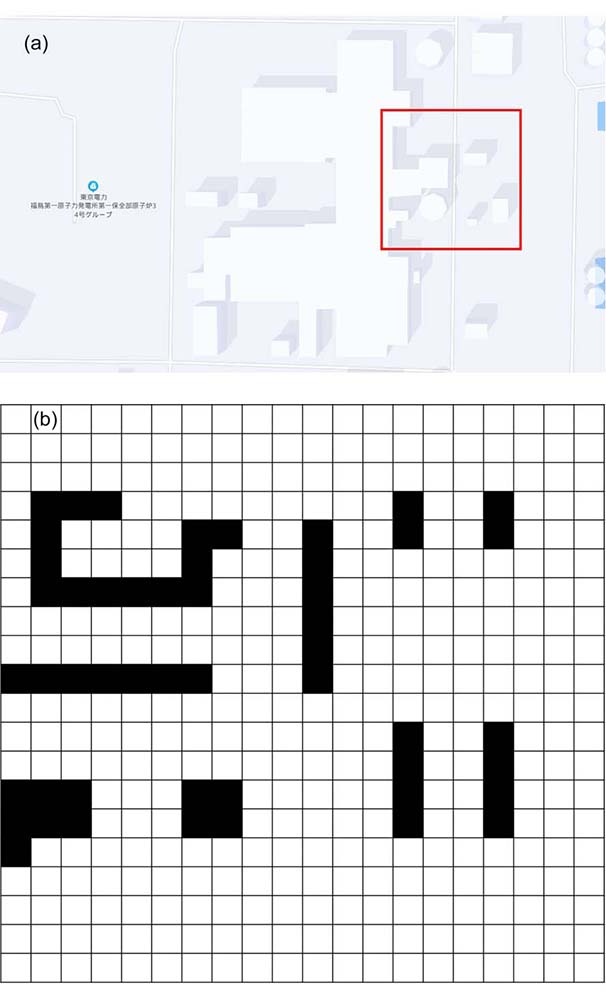
Fig. 1. Map of obstacles to a hypothetical nuclear accident site: (a) reference terrain of the Fukushima Nuclear Power Plant; (b) simulated raster map (color online)
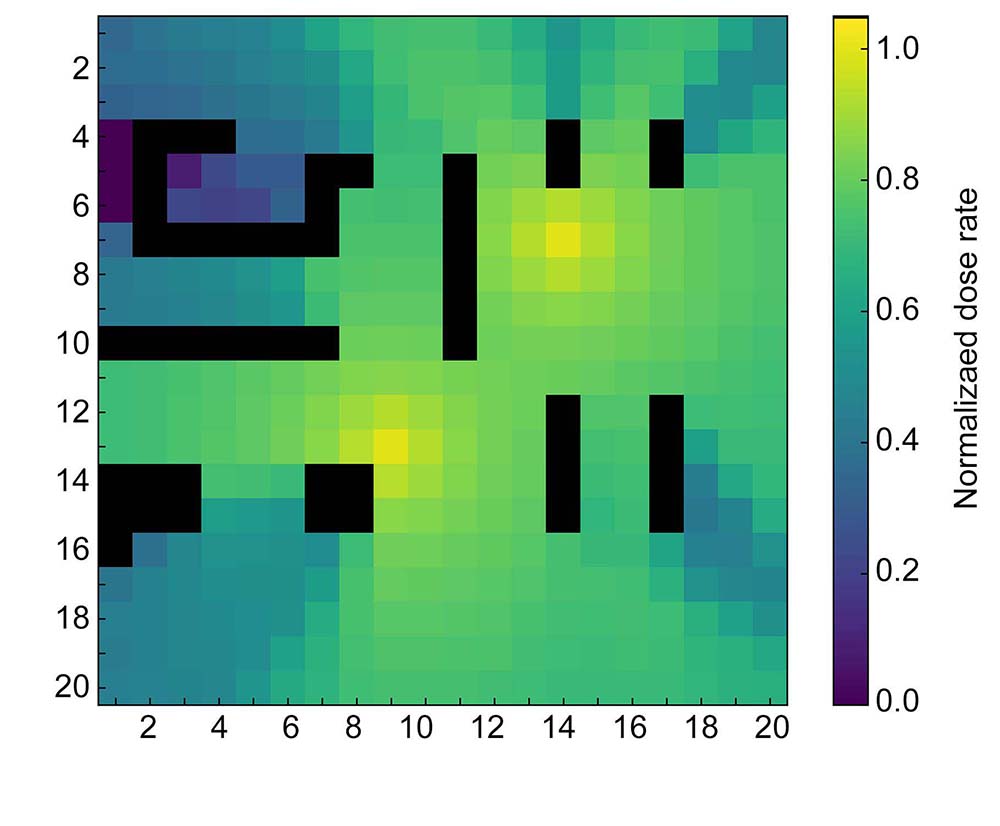
Fig. 2. Normalized radiation dose field calculated by Monte Carlo simulation (color online)
Fig. 3. Diagram of lateral connections of neurons
Fig. 4. Eight bit movement diagram
Fig. 5. Flow chart of unit decomposition method
Fig. 6. Cover times map (color online)
Fig. 7. Real-time dose metrics variation chart: (a) real-time dose rate variation chart; (b) real-time cumulative dose variation chart
Fig. 8. Mobile unit path graph (color online)
Fig. 9. Cow-tillage partition diagram
Fig. 10. Arch overlay strategy diagram
Fig. 11. Flowchart of the algorithm for adding cumulative dose monitoring
Fig. 12. Cover times diagram of 4 units simulation(color online)
Fig. 13. Real-time dose metrics variation chart of 4 units simulation: (a) real-time dose rate variation chart; (b) real-time cumulative dose variation chart (color online)
Fig. 14. Path diagram of 4 units simulation (color online)
Fig. 15. Cover times diagram of 8 units simulation(color online)
Fig. 16. Real-time dose metrics variation chart of 8 units simulation: (a) real-time dose rate variation chart; (b) real-time cumulative dose variation chart (color online)
Fig. 17. Path diagram of 8 units simulation (color online)
|
Table 1. Material element composition
|
Table 2. Radioactive source gamma ray energy composition
|
Table 3. The evaluation index comparison of a unit full coverage simulation test
|
Table 4. Comparison of simulation test results


Set citation alerts for the article
Please enter your email address

© Copyright 2018-2021 | Chinese Laser Press. All Rights Reserved 沪ICP备15018463号-20