• Advanced Photonics Nexus
  • Vol. 2, Issue 5, 056006 (2023)
Yu-Hang Liu1,2, Alexey Kurnikov3, Weiye Li1,2, Pavel Subochev3, and Daniel Razansky1,2,*
Author Affiliations
  • 1University of Zurich, Institute of Pharmacology and Toxicology and Institute for Biomedical Engineering, Faculty of Medicine, Zurich, Switzerland
  • 2ETH Zurich, Institute for Biomedical Engineering, Department of Information Technology and Electrical Engineering, Zurich, Switzerland
  • 3Russian Academy of Sciences, Institute of Applied Physics, Nizhny Novgorod, Russia
  • show less
    DOI: 10.1117/1.APN.2.5.056006 Cite this Article Set citation alerts
    Yu-Hang Liu, Alexey Kurnikov, Weiye Li, Pavel Subochev, Daniel Razansky, "Highly sensitive miniature needle PVDF-TrFE ultrasound sensor for optoacoustic microscopy," Adv. Photon. Nexus 2, 056006 (2023) Copy Citation Text show less
    Design and detection performance characteristics of the miniature needle US sensor. (a) Schematic and external dimensions of the sensor. Preamp, preamplifier. (b) The detected OA signal from a thin black tape and its frequency spectrum.
    Fig. 1. Design and detection performance characteristics of the miniature needle US sensor. (a) Schematic and external dimensions of the sensor. Preamp, preamplifier. (b) The detected OA signal from a thin black tape and its frequency spectrum.
    Sensitivity characterization of the developed needle US sensor and evaluation of the effective US detection area. (a) Schematic of the experimental setup for evaluating the US detection performance. (b) Frequency-dependent normalized signal measurements of the needle US sensor. (c) Corresponding results for a commercial NH0500 hydrophone. (d) Ratio between the curves in (b) and (c). (e) Absolute frequency-dependent sensitivity in μV/Pa. (f) Result of needle US sensor directivity measurements. (g) Schematic of US detection/light scanning area and incident angles for scan points located at the edge of US detection area. The US detection SNR is found to be consistent within this area.
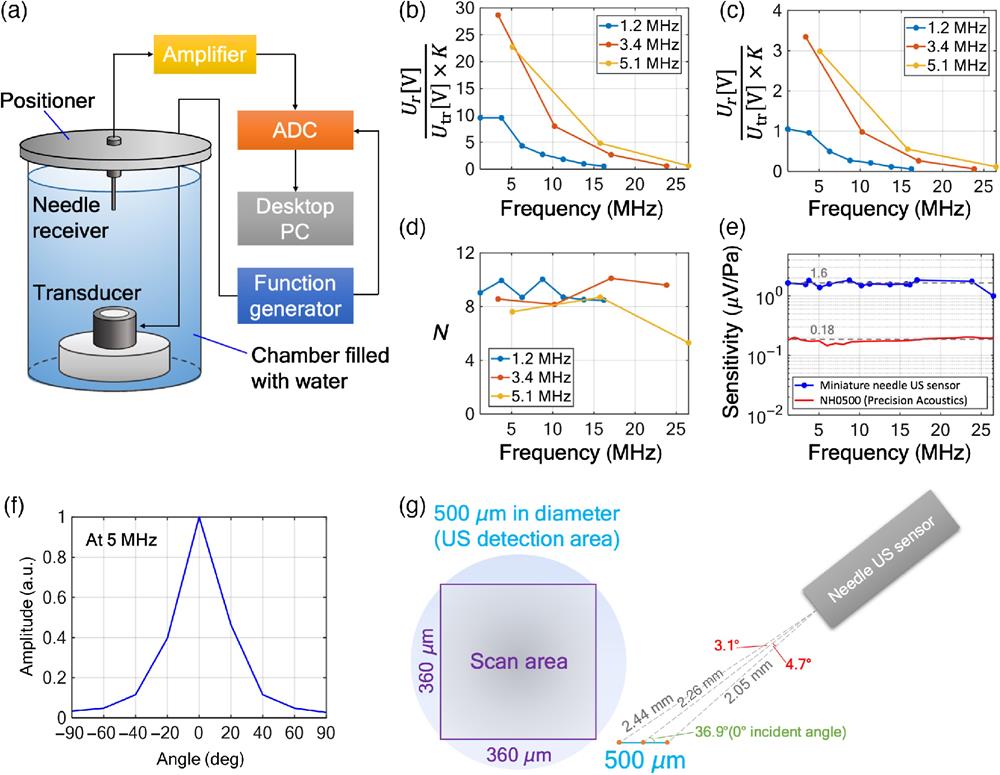
    Fig. 2. Sensitivity characterization of the developed needle US sensor and evaluation of the effective US detection area. (a) Schematic of the experimental setup for evaluating the US detection performance. (b) Frequency-dependent normalized signal measurements of the needle US sensor. (c) Corresponding results for a commercial NH0500 hydrophone. (d) Ratio between the curves in (b) and (c). (e) Absolute frequency-dependent sensitivity in μV/Pa. (f) Result of needle US sensor directivity measurements. (g) Schematic of US detection/light scanning area and incident angles for scan points located at the edge of US detection area. The US detection SNR is found to be consistent within this area.
    The customized optical-resolution light scanning OAM system and image postprocessing measures. (a) Schematic of the system. SL, scan lens; TL, tube lens; M, mirror; DAQ, data acquisition card; Obj, objective lens; and NS, needle US sensor. (b) Image postprocessing pipeline; (c) raw OA image; and (d) processed OA image via the optimized image postprocessing pipeline.
    Fig. 3. The customized optical-resolution light scanning OAM system and image postprocessing measures. (a) Schematic of the system. SL, scan lens; TL, tube lens; M, mirror; DAQ, data acquisition card; Obj, objective lens; and NS, needle US sensor. (b) Image postprocessing pipeline; (c) raw OA image; and (d) processed OA image via the optimized image postprocessing pipeline.
    Images acquired by the light scanning-based OAM system integrated with the needle US sensor. (a) OAM image of a surgical blade; (b) OAM image of 7 μm diameter carbon fibers; (c) in vivo image acquired from a mouse ear; and (d) in vivo mouse brain vasculature image. The green dashed arrows in (c) and (d) denote large (∼29–46 μm diameter) vessels, whereas blue solid arrows denote ∼3–7 μm diameter microcapillaries. The yellow arrowheads indicate individual red blood cells within a microvessel. Scale bars: 50 μm.
    Fig. 4. Images acquired by the light scanning-based OAM system integrated with the needle US sensor. (a) OAM image of a surgical blade; (b) OAM image of 7  μm diameter carbon fibers; (c) in vivo image acquired from a mouse ear; and (d) in vivo mouse brain vasculature image. The green dashed arrows in (c) and (d) denote large (2946  μm diameter) vessels, whereas blue solid arrows denote 37  μm diameter microcapillaries. The yellow arrowheads indicate individual red blood cells within a microvessel. Scale bars: 50  μm.
    PVDF-TrFE (needle US sensor)PVDF (NH0500)
    Thickness (μm)209
    Dielectric constant ε813.5
    Effective area S(mm2)0.20.2
    Film capacitance C0 (pF)0.72.6
    Measured US sensor capacitance C (pF)212
    Electromechanical coupling coefficient kt0.250.15
    Contribution of film capacitance to the total capacitance measurement C0C0.350.21
    Electrical voltage produced by the film U01C01.430.38
    Electrical voltage produced by the US sensor Ukt×U0×C0C0.12430.0127
    Energy transduction coefficient d33×g33=1ρv2kt21kt2 (1012  m2/N)7.652.64
    Measured frequency band (MHz)1.2–25.51–26
    Average sensitivity (μV/Pa)1.60.18
    RMS noise (μV)2230
    NEP (Pa)14166
    NEP (mPa/Hz1/2)2.833
    Table 1. Comparison of material properties and measured parameters of two needle US sensors with different piezo thin films.a
    Yu-Hang Liu, Alexey Kurnikov, Weiye Li, Pavel Subochev, Daniel Razansky, "Highly sensitive miniature needle PVDF-TrFE ultrasound sensor for optoacoustic microscopy," Adv. Photon. Nexus 2, 056006 (2023)
    Download Citation