• Laser & Optoelectronics Progress
  • Vol. 60, Issue 15, 1514004 (2023)
Wenfeng Yang1,*, Dehui Lin1, Mian Zhong1, Shaolong Li1..., Ziran Qian1, Guochun Liu1, Yu Cao2, Yi Xu1, Sai Zhang1 and Guo Li1|Show fewer author(s)
Author Affiliations
  • 1Civil Aircraft Composites Maintenance Research Center, Civil Aviation Flight University of China, Guanghan618307, Sichuan, China
  • 2Laser and Optoelectronic Intelligent Manufacturing Research Institute, Wenzhou University, Wenzhou 325035, Zhejiang, China
  • show less
    DOI: 10.3788/LOP221882 Cite this Article Set citation alerts
    Wenfeng Yang, Dehui Lin, Mian Zhong, Shaolong Li, Ziran Qian, Guochun Liu, Yu Cao, Yi Xu, Sai Zhang, Guo Li. Controllability of Laser Removal of Aircraft Skin Paint Layer Based on Response Surface Analysis[J]. Laser & Optoelectronics Progress, 2023, 60(15): 1514004 Copy Citation Text show less
    Laser processing equipment diagram and process diagram. (a) Laser processing equipment; (b) schematic diagram of the process
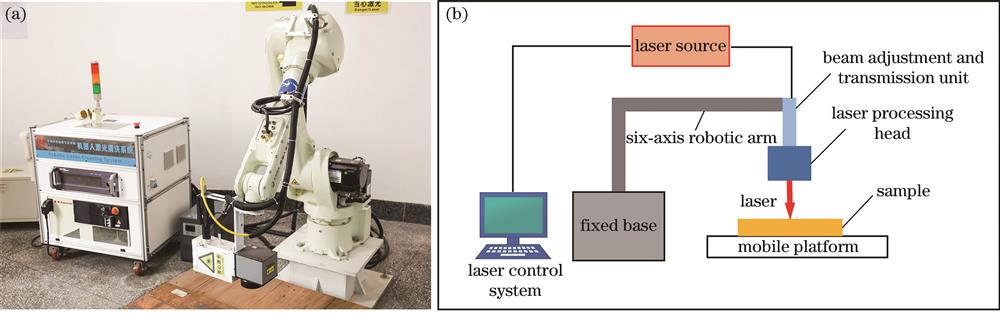
    Fig. 1. Laser processing equipment diagram and process diagram. (a) Laser processing equipment; (b) schematic diagram of the process
    Schematic of laser cleaning. (a) Cleaning area; (b) path of spot scanning
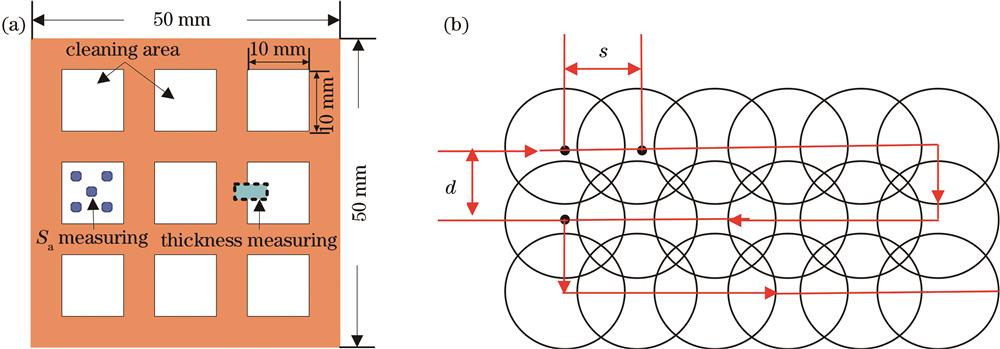
    Fig. 2. Schematic of laser cleaning. (a) Cleaning area; (b) path of spot scanning
    Description of paint removal thickness measurement method
    Fig. 3. Description of paint removal thickness measurement method
    Illustration of the Box-Behnken experimental design with three factors and three levels
    Fig. 4. Illustration of the Box-Behnken experimental design with three factors and three levels
    Effect of laser multiparameter coupling on T
    Fig. 5. Effect of laser multiparameter coupling on T
    Interaction of laser power and number of scans on the thickness of paint removal. (a) Contour graph; (b) response graph
    Fig. 6. Interaction of laser power and number of scans on the thickness of paint removal. (a) Contour graph; (b) response graph
    Effect of laser multiparameter coupling on Sa
    Fig. 7. Effect of laser multiparameter coupling on Sa
    Schematic diagram of the lap joint shape of the crater
    Fig. 8. Schematic diagram of the lap joint shape of the crater
    Interaction of laser power and number of scans on Sa. (a) Contour graph; (b) response graph
    Fig. 9. Interaction of laser power and number of scans on Sa. (a) Contour graph; (b) response graph
    Macro effect and measurements of the samples obtained in scheme 1. (a) Macro effect; (b) thickness of the paint layer removal; (c) surface roughness
    Fig. 10. Macro effect and measurements of the samples obtained in scheme 1. (a) Macro effect; (b) thickness of the paint layer removal; (c) surface roughness
    Macro effect and measurements of the samples obtained in scheme 2. (a) Macro effect; (b) thickness of the paint layer removal; (c) surface roughness
    Fig. 11. Macro effect and measurements of the samples obtained in scheme 2. (a) Macro effect; (b) thickness of the paint layer removal; (c) surface roughness

    Average power

    P /W

    Pulse frequency

    f /kHz

    Beam diameter

    D /μm

    Scan speed

    v /(mm·s-1

    Pulse duration

    τp /ns

    0—1201—200500—800060—350
    Table 1. Main parameters of the laser
    FactorExtreme value
    Low(-1)Medium(0)High(1)
    Power P /W243036
    Spot overlap rate α/%607080
    Number of scans N123
    Table 2. Test factor and level coding table
    No.ParameterResult
    P /Wα /%NT /μmSa /μm
    R12460211.593.13
    R23660224.394.16
    R3306019.822.10
    R43060329.943.02
    R5247016.852.21
    R63670316.742.47
    R72470318.532.43
    R83670265.502.99
    R93070223.053.34
    R103070224.933.31
    R113070227.613.16
    R123070227.593.00
    R133070223.303.87
    R142480218.092.95
    R153680253.843.50
    R163080115.932.31
    R173080360.862.15
    Table 3. Response surface experimental design matrix and experimental results
    SourceSum of squareDegree of freedomMean squareFvalueProb>FSignificant
    Model4652.436775.40121.09<0.0001Yes
    A-α665.761665.76103.97<0.0001
    B-P1388.9111388.91216.90<0.0001
    C-N1968.4711968.47307.41<0.0001
    AB131.681131.6820.560.0011
    AC153.881153.8824.030.0006
    BC343.731343.7353.68<0.0001
    Residual64.03106.40
    Lack of fit44.2567.381.490.3640No
    Pure error19.7844.94
    Cor total4716.4616
    Table 4. Analysis of variance for paint removal thickness model
    SourceSum of squareDegree of freedomMean squareFvalueProb>FSignificant
    Model5.2990.598.140.0057Yes
    A-α0.28010.2803.890.0890
    B-P0.72010.7209.960.0160
    C-N0.28010.2803.890.0892
    AB0.05810.0580.800.4017
    AC0.29010.2904.030.0846
    BC0.02210.0220.310.5943
    A21.012×10-311.012×10-30.0140.9092
    B20.05510.0550.760.4112
    C23.61013.61049.890.0002
    Residual0.51070.072
    Lack of fit0.07630.0250.24No
    Pure error0.43040.110
    Cor total5.80016
    Table 5. Analysis of variance for surface roughness model
    NameCriteriaWeight
    GoalLowerUpper
    Spot overlap rate α /%In range60801
    Power P /WIn range24361
    Number of scans NEqual to 2131
    Paint layer removal thickness T /μmTarget(30/50)6.8565.501
    Surface roughnessSa /μmMaximize2.104.161
    Table 6. Optimization criteria and weight
    TargetNo.T /μmError /μmSa /μmError /%TargetNo.T /μmError /μmSa /μmError /%
    30 μmPre30.003.9550 μmPre50.003.54
    L129.060.943.580.37T145.544.463.370.17
    L227.502.503.780.17T248.181.823.670.13
    L328.371.633.640.31T351.881.883.450.09
    Table 7. Optimization results of parameter coupling and experimental verification
    Wenfeng Yang, Dehui Lin, Mian Zhong, Shaolong Li, Ziran Qian, Guochun Liu, Yu Cao, Yi Xu, Sai Zhang, Guo Li. Controllability of Laser Removal of Aircraft Skin Paint Layer Based on Response Surface Analysis[J]. Laser & Optoelectronics Progress, 2023, 60(15): 1514004
    Download Citation