
Shiyu Deng, Fen Hu, Mengdi Hou, Jianyu Yang, Imshik Lee, Leiting Pan. Effect of Species Specificity of the Secondary Antibody on Two-Color STORM Imaging (Invited)[J]. Laser & Optoelectronics Progress, 2024, 61(6): 0618008
- Laser & Optoelectronics Progress
- Vol. 61, Issue 6, 0618008 (2024)

Fig. 1. Immunofluorescent labeling and secondary antibody pre-adsorption. (a) Direct and indirect immunofluorescent labeling methods; (b) secondary antibody pre-adsorption; (c) cross-reactivity of secondary antibodies
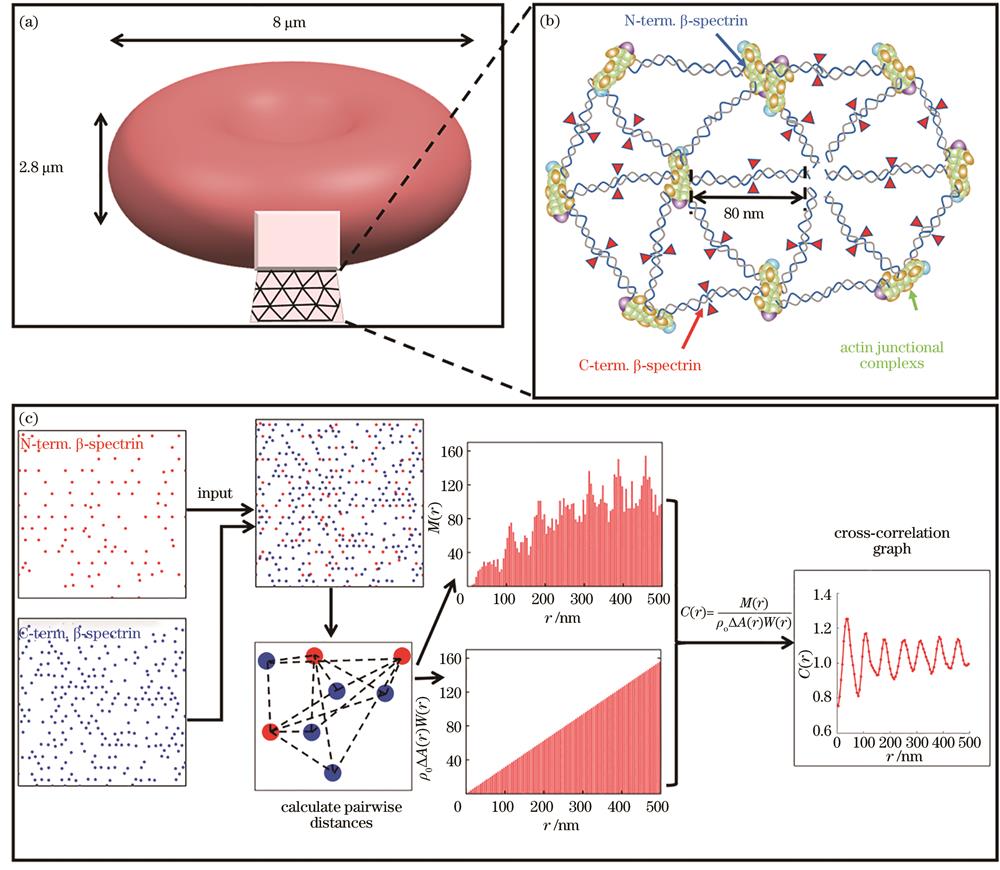
Fig. 2. Schematic of erythrocyte skeleton and flowchart of the cross-correlation analysis algorithm. (a) Morphology of erythrocyte. The inset shows the membrane skeleton in the form of a triangular lattice network; (b) model of erythrocyte skeleton; (c) flowchart of the cross-correlation analysis algorithm
Fig. 3. Simulations for two-color STORM imaging of erythrocyte β-spectrin N-terminal and C-terminal. (a) Simulation of two-color STORM imaging with zero cross-reactivity; (b) local magnification in Fig.3(a); (c) cross-correlation analysis between points in two channels in Fig.3(a); (d) nearest neighbor analysis between points in two channels in Fig.3(a); (e) simulation of two-color STORM imaging with 1% cross-reactivity; (f) local magnification in Fig.3(e); (g)‒(l) cross-correlation analysis and nearest neighbor analysis with 1%, 5%, 10% cross-reactivity
Fig. 4. Effect of secondary antibody species specificity on two-color conventional immunofluorescence and STORM imaging. (a)(b) Two-color conventional immunofluorescence imaging of erythrocyte β-spectrin N- and C-terminal labeled with low- or high-adsorption secondary antibody; (c) Manders' correlation analysis and Spearman's rank correlation analysis for five different regions in Fig.4(a) and Fig.4(b); (d) STORM image corresponding to Fig.4(a); (e) local magnification in Fig.4(d); (f) (g) cross-correlation analysis and the nearest neighbor distance analysis for the data in the rectangular box in Fig.4(d); (h) STORM image corresponding to Fig.4(b); (i) local magnification in Fig.4(h); (j) (k) cross-correlation analysis and the nearest neighbor distance analysis for the data in the rectangular box in Fig.4 (h)
Fig. 5. Two-color STORM imaging of CD47 and PD-L1 in MDA-MB-231 cells. (a) Two-color STORM image obtained by high-adsorption secondary antibody labeling; (b) local magnification in Fig.5(a); (c) cross-correlation analysis for the data in the rectangular box in Fig.5(a); (d) two-color STORM image obtained by low-adsorption secondary antibody labeling; (e) local magnification in Fig.5(d); (f) cross-correlation analysis for the data in the rectangular box in Fig.5(d)


Set citation alerts for the article
Please enter your email address

© Copyright 2018-2021 | Chinese Laser Press. All Rights Reserved 沪ICP备15018463号-20