• Laser & Optoelectronics Progress
  • Vol. 56, Issue 10, 101401 (2019)
Lu Pan1,2,*, Chenglin Zhang2, Liang Wang2, Qihui Liu2, and Gang Wang3
Author Affiliations
  • 1 Department of Mechanical Engineering, Anhui Technical College of Mechanical and Electrical Engineering, Wuhu, Anhui 241002, China
  • 2 Anhui Tuo Bao Additive Manufacturing Technology Co. Ltd., Wuhu, Anhui 241300, China
  • 3 School of Mechanical and Automotive Engineering, Anhui Polytechnic University, Wuhu, Anhui 241000, China
  • show less
    DOI: 10.3788/LOP56.101401 Cite this Article Set citation alerts
    Lu Pan, Chenglin Zhang, Liang Wang, Qihui Liu, Gang Wang. Crack Formation Law and Mechanism in Selective Laser Melting of 316L Stainless Steels[J]. Laser & Optoelectronics Progress, 2019, 56(10): 101401 Copy Citation Text show less
    Morphology of 316L stainless steel powder
    Fig. 1. Morphology of 316L stainless steel powder
    Macrographs of printed samples
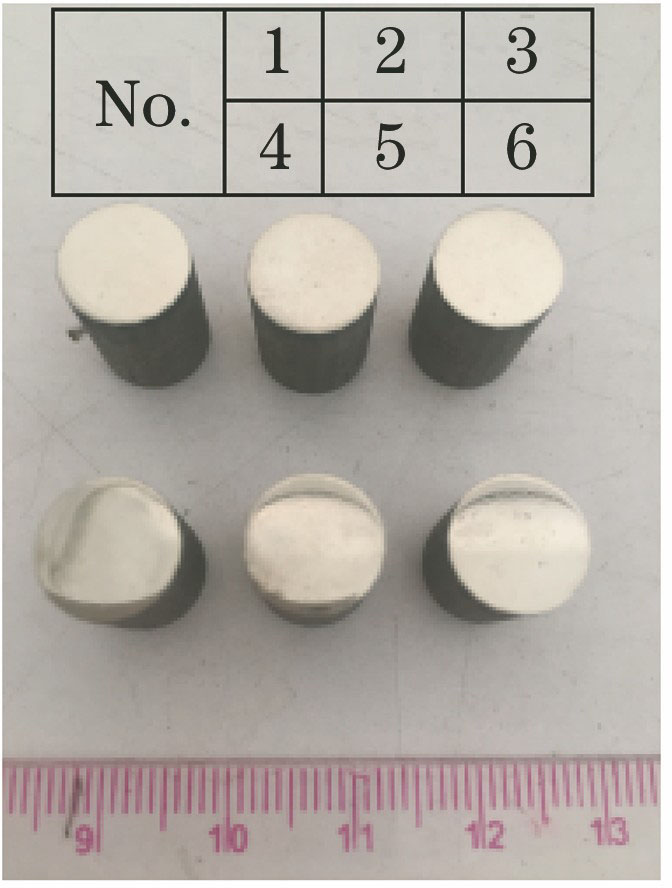
    Fig. 2. Macrographs of printed samples
    Cracks under different process parameters. (a)Line energy density of 181.8 J/m; (b) line energy density of 250 J/m; (c) line energy density of 475 J/m; (d) line energy density of 583.3 J/m; (e) line energy density of 633.3 J/m; (f) line energy density of 875 J/m
    Fig. 3. Cracks under different process parameters. (a)Line energy density of 181.8 J/m; (b) line energy density of 250 J/m; (c) line energy density of 475 J/m; (d) line energy density of 583.3 J/m; (e) line energy density of 633.3 J/m; (f) line energy density of 875 J/m
    Defects and defect proportion versus line energy density. (a) Different defects versus line energy density; (b) different crack defects versus line energy density
    Fig. 4. Defects and defect proportion versus line energy density. (a) Different defects versus line energy density; (b) different crack defects versus line energy density
    Overall crack morphology
    Fig. 5. Overall crack morphology
    Local amplification of cracks. (a) Area C; (b)area D
    Fig. 6. Local amplification of cracks. (a) Area C; (b)area D
    Typical crack positions
    Fig. 7. Typical crack positions
    EBSD diagram of crack. (a) Morphologies and sizes of grains at cracks; (b) precipitated phase compositions at cracks
    Fig. 8. EBSD diagram of crack. (a) Morphologies and sizes of grains at cracks; (b) precipitated phase compositions at cracks
    Micromorphology at end of hot crack in 316L steel
    Fig. 9. Micromorphology at end of hot crack in 316L steel
    Defect maps. (a) Digital photographic physical map; (b) surface morphology of the sample
    Fig. 10. Defect maps. (a) Digital photographic physical map; (b) surface morphology of the sample
    CrNiMoMnPSiSC
    16.0-18.010.0-14.02.0-3.0≤2.00≤0.035≤1.00≤0.03≤0.03
    Table 1. Chemical composition of 316L stainless steel used in SLM forming (mass fraction, %)
    No.123456
    Power /W200200380350380350
    Speed /(mm·s-1)1100800800600600400
    Line energydensity /(J·m-1)181.8250.0475.0583.3633.3875.0
    Table 2. Process parameters for SLM formation
    ElementFeCrNiMoSiOCSKClCa
    Point 166.017.812.92.50.8
    Point 234.113.57.11.112.71.10.30.1
    Point 353.52.01.00.337.15.10.30.30.3
    Table 3. EDS analysis results of typical pointsinside and outside cracks (mass fraction, %)
    ElementPoint 1Point 2Point 3Point 4
    Cr24.0018.2916.8519.64
    Fe76.0059.8864.3572.56
    Ni21.8315.56.28
    C3.33
    O2.08
    Table 4. EDS analysis results of typical points inside and outside cracks
    Lu Pan, Chenglin Zhang, Liang Wang, Qihui Liu, Gang Wang. Crack Formation Law and Mechanism in Selective Laser Melting of 316L Stainless Steels[J]. Laser & Optoelectronics Progress, 2019, 56(10): 101401
    Download Citation