
Kunyao Zhu, Yi Jiang. Recent progresses of Optical Frequency Domain Reflectometry[J]. Laser & Optoelectronics Progress, 2024, 61(5): 0500002
- Laser & Optoelectronics Progress
- Vol. 61, Issue 5, 0500002 (2024)
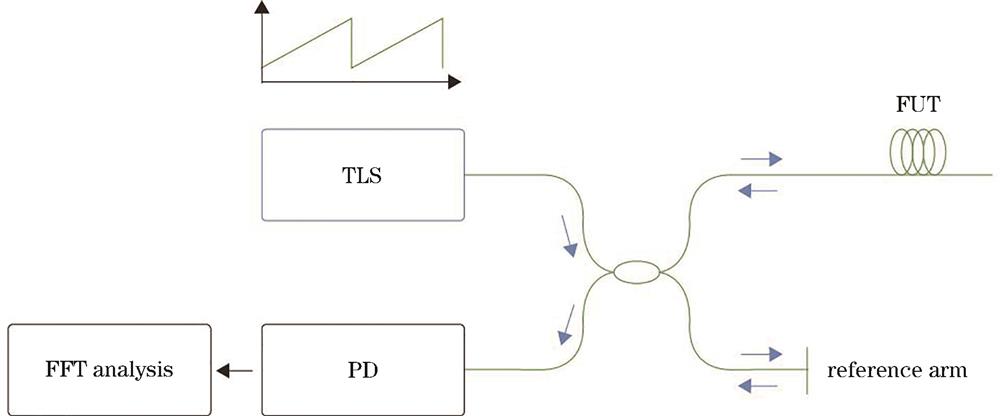
Fig. 1. Typical structure of OFDR system

Fig. 2. Demodulation process of OFDR system. (a) Demodulation steps; (b) schematic diagram of signal processing
Fig. 3. TLS sweep frequency and spatial resolution[7]. (a) Without nonlinear sweep frequency; (b) with nonlinear sweep frequency
Fig. 4. Structure of long-distance OFDR system based on OPLL[14]
Fig. 5. Dynamic frequency noise of OFDR system using OPLL[14]
Fig. 6. Schematic diagram of sweep laser generation controlled by optically locked phase[15]
Fig. 7. Hardware compensation method[16]. (a) Schematic diagram of beat signal and sampling point under nonlinear frequency sweep; (b) schematic diagram of beat signal generation
Fig. 8. Zero-crossing detection OFDR[21]. (a) Auxiliary interferometer signal zero-crossing detection circuit scheme; (b) timing analysis of each node of the circuit
Fig. 9. NUFFT signal processing steps[25]
Fig. 10. Schematic diagram of PNC-OFDR system using GCP for phase compensation [26]
Fig. 11. Rayleigh intensity curve of PNC-OFDR system before and after phase noise compensation and spatial resolution at 40 km[27]
Fig. 12. Signal processing diagram of declining filter method[29]
Fig. 13. TGD-OFDR system experimental configuration[33]
Fig. 14. PDIR algorithm flow[37]
Fig. 15. Typical OFDR and DSB-PNC OFDR[46]. (A) Typical OFDR; (B) DSB-PNC OFDR
Fig. 16. OFDR system with bidirectional decision algorithm[51]
Fig. 17. OFDR system based on I/Q detection[52]
Fig. 18. FUT strain distribution solved by recursive demodulation compensation method[58]
Fig. 19. CCSA process[61]
Fig. 20. OFDR system based on moving time gating method[63]
Fig. 21. Signal processing flow of moving time gating method[63]
Fig. 22. Vibration sensing system combined with TGD-OFDR and MZI[64]
Fig. 23. Schematic diagram of sensor prototype[67]
Fig. 24. γ radiation measurement using OFDR[69]. (a) Experimental setup; (b) experimental result
|
Table 1. Comparison of several typical phase noise compensation methods
|
Table 2. Comparison of improving performance methods of typical OFDR systems


Set citation alerts for the article
Please enter your email address

© Copyright 2018-2021 | Chinese Laser Press. All Rights Reserved 沪ICP备15018463号-20