
Wenyu Kang, Jing Zheng, Jiaxin Huang, Lina Jiang, Qingna Wang, Zhinan Guo, Jun Yin, Xianming Deng, Ye Wang, Junyong Kang. Deep-ultraviolet photonics for the disinfection of SARS-CoV-2 and its variants (Delta and Omicron) in the cryogenic environment[J]. Opto-Electronic Advances, 2023, 6(9): 220201
- Opto-Electronic Advances
- Vol. 6, Issue 9, 220201 (2023)
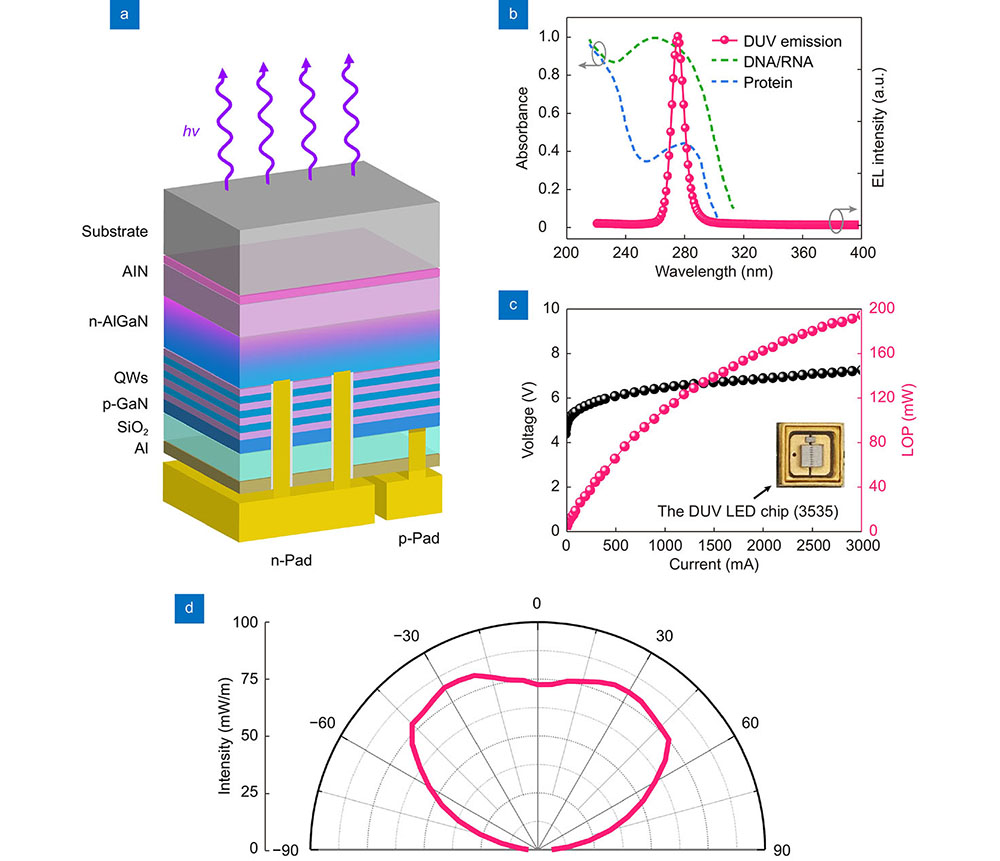
Fig. 1. The fabricated DUV LED chip. (a ) Schematic diagram of the LED structure. (b ) Electroluminescence (EL) spectrum of the fabricated chip. The green and blue dotted lines were the standard absorption spectra of DNA/RNA and proteins extracted from published values, respectively (also known as germicidal effectiveness curve).15 (c ) Measured I-V and LOP characteristics of the chip. (d ) Angular emission pattern for the chip.

Fig. 2. The assembled DUV module. (a ) Schematic diagram of the module. Two monitors were used to show the temperature of the cooling plate and the driving current of the whole module. (b ) Photo of the module in work (left, where 64 LED chips were inset) and the corresponding optical power density measurement (right, the distance between the light source and projection was 4.5 cm). (c ) DUV inactivation tests on the ATCC 6538 and H1N1 at 23 °C. CFU and TCID50 stood for colony-forming units and 50% tissue culture infectious dose, respectively.
Fig. 3. DUV disinfection on the ATCC 6538. (a -e ) DUV virucidal efficacy at five experimental temperatures. The r is the first-order inactivation rate constant, and r1 and r2 indicate for the first and second stage of the typical two-stage inactivation performance, respectively. (f ) Fitting model of the DUV virucidal efficacy under different environment temperatures based on the Arrhenius equation. T(°C) is the temperature in degrees centigrade.
Fig. 4. DUV disinfection on SARS-CoV-2 and its variants. Symbols *, **, and *** denoted for p value < 0.05, 0.01, and 0.001 respectively from the multivariate ANOVA analyses, and the results of Fisher’s least significant difference (LSD) post-hoc test were simultaneously indicated by the clustering. ( a ) SARS-CoV-2 inactivation changing with the coeffects between different temperatures and DUV doses. (b ) Difference between viral strains and their response surfaces of DUV inactivation.
Fig. 5. Influence of temperature on the DUV disinfection. (a ) Configuration coordinate for situation without the effect from photon and temperature. ∆Ebarrier was the energy difference between the barrier and the energy states. (b ) The electroacoustic coupling process in which electrons in genetic material (DNA or RNA) being affected by a photon or temperature. ET and EP represented thermal and photonic energy, respectively. (c ) The accumulation process induced by the electroacoustic coupling, in which the negative U model was involved. S0 and Sn stood for the state before disinfection and the state after disinfection, respectively. (d ) The influence of low- (left) and high-temperature (right) on the DUV disinfection. S0, S1, and S2 stood for the ground state and two final states, respectively. C1 and C2 were the chances of capture.
Fig. 6. Influence from the variant Omicron on DUV disinfection. (a ) The aspect of the gene sequence. (b ) The aspect of proteins. I0 to I3 represented the intensities of DUV from the initial state passing through the S proteins and getting into the M proteins, respectively. The abbreviation of S and M stood for spike and membrane proteins. (c ) The possible photochemical changes by the high-intensity UV (the DUV-induced gene mutations).
Fig. 7. DUV disinfection suggestion against the SARS-CoV-2. (a –c ) DUV virucidal efficacy for Omicron at three experimental temperatures. (d ) Fitting model of the DUV virucidal efficacy for Omicron under different environment temperatures based on the Arrhenius equation. (e ) DUV dose required to achieve different lethality at different temperatures. (f ) DUV dose forecast for obtaining a 3-log reduction of the Omicron in Chinese winter (according to the Mean January temperature).
|
Table 1. Multivariate ANOVA of SARS-CoV-2 inactivation by DUV irradiation with two-way interaction.


Set citation alerts for the article
Please enter your email address

© Copyright 2018-2021 | Chinese Laser Press. All Rights Reserved 沪ICP备15018463号-20