• Infrared and Laser Engineering
  • Vol. 52, Issue 8, 20230428 (2023)
Nan Gao1, Yongbo Yu1, Zhenhui Du2, Jinyi Li3..., Zhaozong Meng1 and Zonghua Zhang1|Show fewer author(s)
Author Affiliations
  • 1School of Mechanical Engineering, Hebei University of Technology, Tianjin 300130, China
  • 2State Key Laboratory of Precision Measuring Technology and Instruments, Tianjin University, Tianjin 300072, China
  • 3Key Laboratory of Advanced Electrical Engineering and Energy Technology, Tiangong University, Tianjin 300387, China
  • show less
    DOI: 10.3788/IRLA20230428 Cite this Article
    Nan Gao, Yongbo Yu, Zhenhui Du, Jinyi Li, Zhaozong Meng, Zonghua Zhang. Research on harmonic detection pressure inversion based on Gauss/Lorentz line fitting ratio (invited)[J]. Infrared and Laser Engineering, 2023, 52(8): 20230428 Copy Citation Text show less
    Simulation curve: (a) The original Lorentz function accounts for 5% of the total peak width; (b) The original Lorentz function accounts for 95% of the total peak width
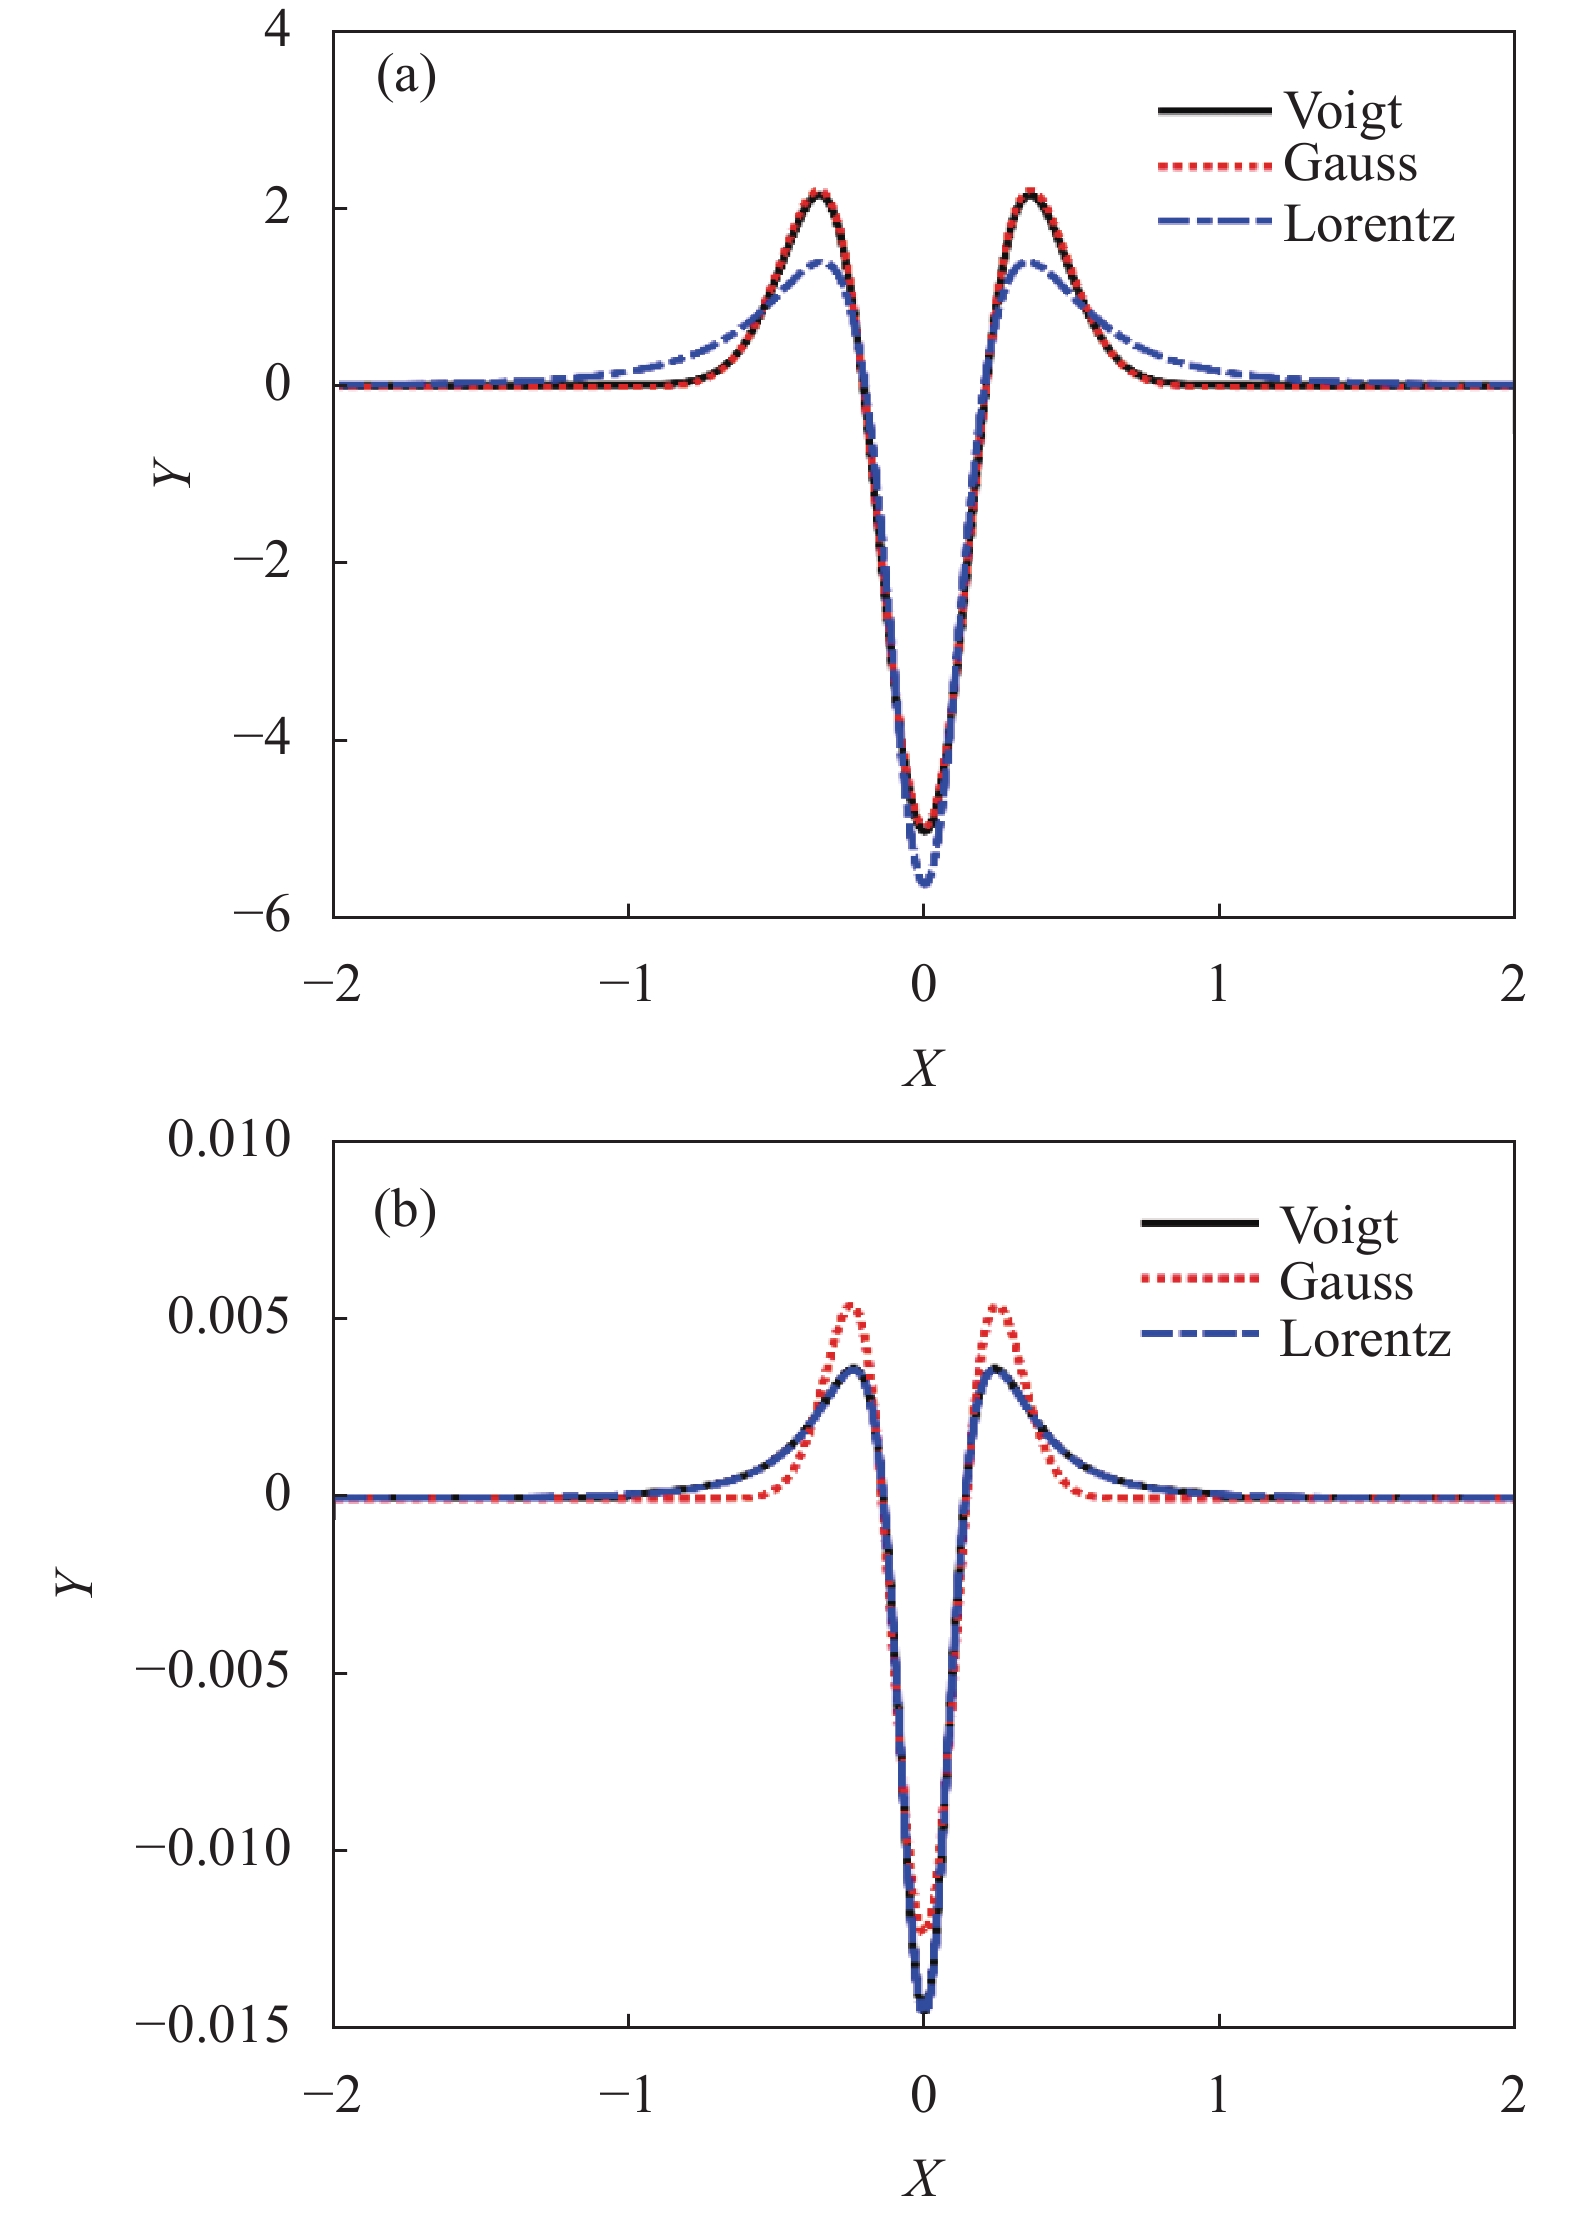
    Fig. 1. Simulation curve: (a) The original Lorentz function accounts for 5% of the total peak width; (b) The original Lorentz function accounts for 95% of the total peak width
    Fitting curve of pressure and Y
    Fig. 2. Fitting curve of pressure and Y
    Curve comparison of pressure and Y after adding the laser linewidth
    Fig. 3. Curve comparison of pressure and Y after adding the laser linewidth
    Curve comparison of pressure and Y after adding white noise with different amplitude coefficients
    Fig. 4. Curve comparison of pressure and Y after adding white noise with different amplitude coefficients
    When the frequency is 0.1 times the signal frequency, the curve comparison of pressure and Y after adding background interference of different amplitudes
    Fig. 5. When the frequency is 0.1 times the signal frequency, the curve comparison of pressure and Y after adding background interference of different amplitudes
    Curve comparison of the pressure and Y after adding background interference of different frequencies
    Fig. 6. Curve comparison of the pressure and Y after adding background interference of different frequencies
    The effect of background frequency changes on mathematical models
    Fig. 7. The effect of background frequency changes on mathematical models
    Gauss fitting and Lorentz fitting curves under different pressures
    Fig. 8. Gauss fitting and Lorentz fitting curves under different pressures
    The fitting curve of measured pressure and Y
    Fig. 9. The fitting curve of measured pressure and Y
    Influencing factorsNoise changesBackground amplitude changesBackground frequency changes
    The ratio of the fitting of Gauss and Lorentz0.000 868 80.054 380.005 514
    Peak width0.011 280.168 90.071 97
    Amplitude of 2f/4f0.001 1940.070 070.026 55
    Table 1. The standard deviation of three eigenvalues of the same spectral line in different noise and background
    Nan Gao, Yongbo Yu, Zhenhui Du, Jinyi Li, Zhaozong Meng, Zonghua Zhang. Research on harmonic detection pressure inversion based on Gauss/Lorentz line fitting ratio (invited)[J]. Infrared and Laser Engineering, 2023, 52(8): 20230428
    Download Citation