
Qiang Song, Liang Wang, Xiaoyin Zhang, Yan Liu, Jing Zhang, Xiangfeng Kong. Research Progress of Optical Fiber Sensors Based on Novel Fluorescent Materials: Dissolved Oxygen, pH, and Carbon Dioxide[J]. Laser & Optoelectronics Progress, 2023, 60(17): 1700004
- Laser & Optoelectronics Progress
- Vol. 60, Issue 17, 1700004 (2023)
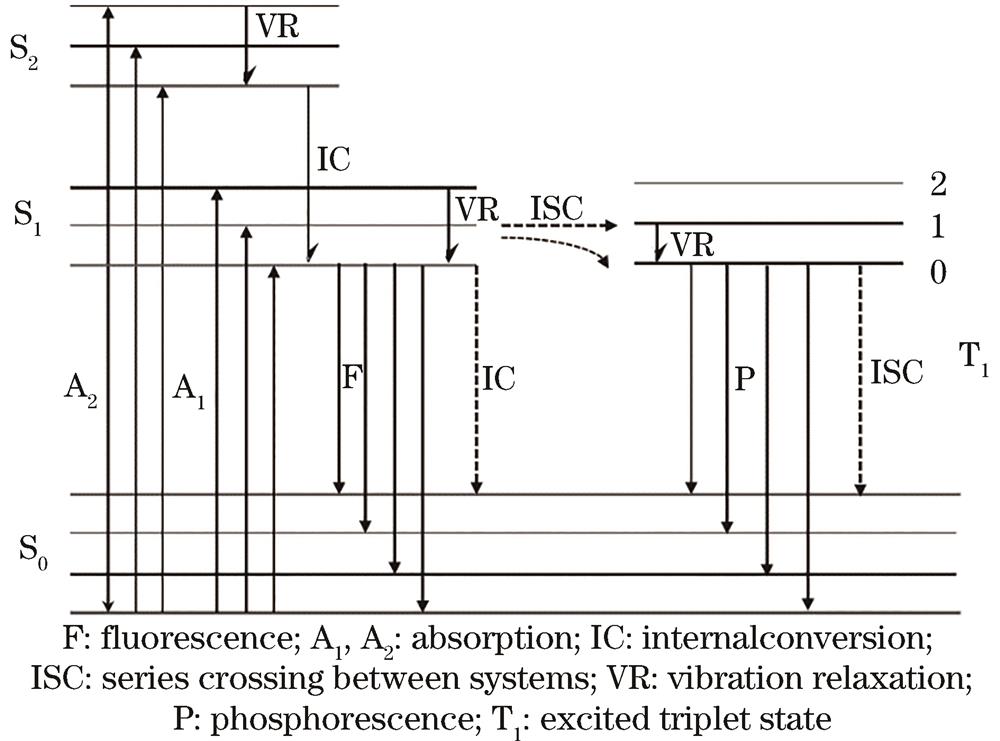
Fig. 1. Schematic diagram of fluorescence excitation
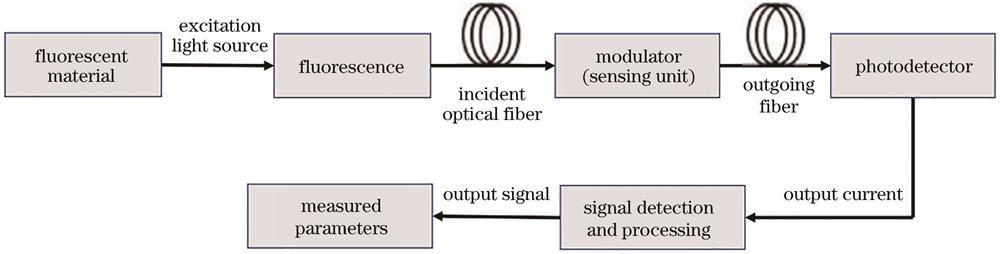
Fig. 2. Basic structure and working principle of fluorescent optical fiber sensing system
Fig. 3. Detection principle of dissolved oxygen optical fiber sensor[16].(a) Schematic diagram of evanescent wave generation; (b) schematic diagram of dissolved oxygen detection process; (c) schematic diagram of instrumental setup and flow cell design
Fig. 4. Schematic diagram of luminescence process of lanthanide metal ions[26]
Fig. 5. Crystal structures[27].(a) Crystal structure of EuNDC; (b) tetrahedral crystal structure; (c) octahedral crystal structure
Fig. 6. Upper: pH responsive DAOTA dyes 1a and 1b in protonated form and reference DMQA dye 2; bottom: with light emitting diode (LED) light source, optical fiber connector, photodiode/sensor point and optical fiber spectrometer detector[40]
Fig. 7. Crystal structure and PXRD spectra[44].(a) Crystal structure of Tb-MOF; (b) PXRD patterns of as-synthesized Eu0.034Tb0.966-NMOF and Eu0.034Tb0.966-NMOF soaked in water with pH values of 3.00 and 11.00, and simulated Tb-MOF from X-ray single structure
Fig. 8. Diagram of preparation process of CDs@UiO-66 (OH)2 using solvent-free method[47]
Fig. 9. Spatial topology and fluorescence emission spectra[48].(a) Spatial topological structure of Zr-TCPBP; (b) fluorescence emission spectra of Zr-TCPBP in aqueous solution with pH of 1.10-6.70
Fig. 10. Schematic diagram of pH detection with LMOFl and γ-Fe2O3@LMOF1[49]
Fig. 11. Schematic diagram of pH response of MOF/PC materials[50]
Fig. 12. Scheme for synthesis of UIO-66-ONa by Schiff Base reaction[63]
|
Table 1. Summary of fluorescent dissolved oxygen optical fiber sensing research
|
Table 2. Summary of fluorescent pH optical fiber sensing research
|
Table 3. Summary of fluorescent carbon dioxide optical fiber sensing research


Set citation alerts for the article
Please enter your email address

© Copyright 2018-2021 | Chinese Laser Press. All Rights Reserved 沪ICP备15018463号-20