• Chinese Optics Letters
  • Vol. 22, Issue 8, 081202 (2024)
Qiheng Wei1, Xueqian Wang2, Hongrui Shan1, Yi Lai3..., He Li3, Hailang Dai1,* and Xianfeng Chen1,4,**|Show fewer author(s)
Author Affiliations
  • 1State Key Laboratory of Advanced Optical Communication Systems and Networks, School of Physics and Astronomy, Shanghai Jiao Tong University, Shanghai 200240, China
  • 2State Key Laboratory of Metal Matrix Composites, Shanghai Key Laboratory for Molecular Engineering of Chiral Drugs, School of Materials Science and Engineering, Shanghai Jiao Tong University, Shanghai 200240, China
  • 3Department of Head and Neck Surgery and Department of Traditional Chinese Medicine, Renji Hospital, School of Medicine, Shanghai Jiao Tong University, Shanghai, China
  • 4Collaborative Innovation Center of Light Manipulations and Applications, Shandong Normal University, Jinan 250358, China
  • show less
    DOI: 10.3788/COL202422.081202 Cite this Article Set citation alerts
    Qiheng Wei, Xueqian Wang, Hongrui Shan, Yi Lai, He Li, Hailang Dai, Xianfeng Chen, "Chirality discerning and monitoring in a metal cladding optofluidic chip," Chin. Opt. Lett. 22, 081202 (2024) Copy Citation Text show less

    Abstract

    The metabolic process of chiral drugs plays a significant role in clinics and in research on drugs. Here, we experimentally demonstrate by all-optical means that the chiral molecules can be quickly discriminated and monitored with the ultrahigh-order modes excited in a metal cladding optofluidic chip, achieving over 5 times sensitivity with a low-dosage sample. We show that the varying concentration of the chiral drugs can be monitored both in cell and animal experiments, presenting a significant difference between chiral enantiomers at the optimal function time and the effect of the reaction. To our knowledge, this approach provides a new way to achieve important chiral discrimination for the pharmacokinetics and the pharmacodynamics and may present opportunities in indicating the health status of humans.

    1. Introduction

    From the physics of elementary particles to the chemistry of life, chirality is an essential property in modern science and occurs widely in physical structures such as DNA, sugars, and amino acids[14]. Chiral molecules are molecules with mirror images that cannot be superimposed on each other, called enantiomers, and are characterized by extremely different biological activities and toxicities[5,6]. For example, limonene with different handedness has a different smell, which has important consequences, as in the case of the fruit fly pheromone Olean, where one-handedness attracts females and the other attracts males[7]. Moreover, in the pharmaceutical industry, chirality plays a vital role in which one enantiomer may act as a drug and another enantiomer can be inactive or even lead to serious side effects[811]. For example, thalidomide, often mentioned as a therapeutic example, provides an effective relief medication for morning sickness in pregnant women, but the mirror image causes severe birth defects. Therefore, the ability to discern chirality with high sensitivity and high speed in the pharmacokinetics and the pharmacodynamic profiles is highly desirable. The chiroptical effect is a special property of chiral materials in that the optical responses to the left-handed (LCP) and right-handed circularly polarized (RCP) light are different[12,13]. Thus, circular dichroism (CD) and optical rotation (OR) can be utilized to distinguish chiral systems, in which CD is induced by different extinction coefficients[1416] and the OR is based on the different phase velocities for LCP/RCP light[1719]. Moreover, high-performance liquid chromatography (HPLC) is characterized by high-resolution chirality detection owing to chiral solid phase separation[20]. However, biomolecular applications of these methods are hindered by the complex sample preparation and the high cost of chiral columns. In addition, the metabolic processing of chiral molecules and enantiomer drugs cannot be quickly monitored in cell and animal experiments due to the lack of sensitivity for the chiroptical effect and the complexity of HPLC. Therefore, it is important to develop a method that can overcome the drawbacks and better monitor chiral molecular metabolism in life.

    The metal cladding optofluidic chip (MCOC) possesses a variety of fascinating optical properties[2125]. The unique feature is the excitation of ultrahigh-order guided modes (UOMs) in the cavity under illumination. Moreover, the reflective coefficient of UOMs is extremely sensitive to the dielectric coefficient of the guided layer. For the MCOC, the reduced dispersion equation for the mth-order eigenmode can be written as k0dn2Neff2=mπ,where Neff is the effective refractive index. The incident beam meeting coupling condition (the component of the wave vector along the propagation direction resonates with the propagation constant of the eigenmodes) will be coupled into the wave guide, resulting in coupling peaks. The coupling peak is particularly sensitive to the refractive index so that the sensitivity s is defined as s=dNeffdn=nNeff,where the sensitivity approaches infinity with Neff approaching zero in UOMs[26].

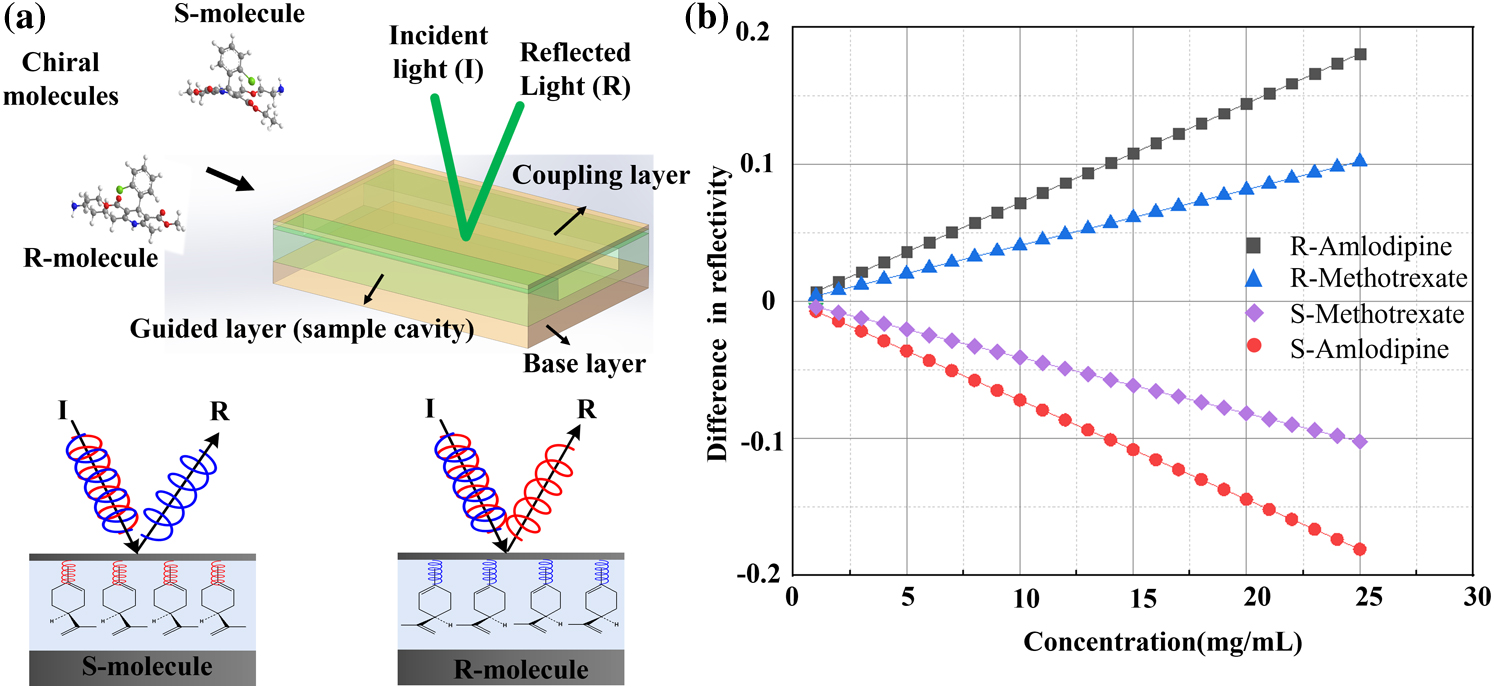
    Based on these properties, we demonstrated the discrimination of two pairs of chiral molecules in cell and animal experiments. As shown in Fig. 1(a), the intensity of LCP/RCP light shows a difference in reflective light when the chiral molecule is injected into MCOC due to the different dielectric coefficients of the chiral molecules for LCP and RCP. The difference in reflectivity of LCP/RCP, D, can be expressed as (see more details in Supplementary Material Section I) D=KΔε2,where Δε2 is the change in the dielectric coefficient for LCP light (thus, Δε2 for RCP light). K is the characteristic parameters determined by the MCOC. Therefore, the difference in reflectivity of LCP and RCP will be characterized by opposite signs for a pair of chiral enantiomers. Furthermore, the absolute value is proportional to the concentration of the chiral molecules, as shown in Fig. 1(b). With these properties, chiral drug molecule metabolism processing can be monitored in cells and organs.

    Schematic of the MCOC and the discerning process. (a) The MCOC consists of a coupling layer, a guided layer (containing cavity), and a base layer. When chiral molecules with different chirality are injected into the cavity, the reflected beam is altered. For example, the R-limonene molecules exhibit high reflectivity for left-handed circularly polarized lasers, while S-limonene exhibits high reflectivity for right-handed circularly polarized lasers. (b) Theoretical results of the difference in reflectivity.

    Figure 1.Schematic of the MCOC and the discerning process. (a) The MCOC consists of a coupling layer, a guided layer (containing cavity), and a base layer. When chiral molecules with different chirality are injected into the cavity, the reflected beam is altered. For example, the R-limonene molecules exhibit high reflectivity for left-handed circularly polarized lasers, while S-limonene exhibits high reflectivity for right-handed circularly polarized lasers. (b) Theoretical results of the difference in reflectivity.

    2. Results

    To demonstrate the ability to distinguish chiral molecules, we measured the difference in reflectivity of prepared methotrexate (MTX) and amlodipine (ADP) molecule solutions. The results showed that the difference in reflectivity of two pairs of chiral molecules is proportional to the concentration with the opposite sign coefficient, which is consistent with theoretical predictions. The experimental setup is shown in Fig. 2(a). The power and spin angular momentum (SAM) of the laser beam (generated by a 100 mW 532 nm laser) are controlled by a combination of a half-wave plate (HWP), quarter-wave plates (QWPs), and a linear polarizer (LP). Two photoelectric detectors (PDs) are used to detect the incident and reflective beam intensities. The samples of the prepared chiral molecule solution are injected into the MCOC with a microsyringe system. Then, the reflectivity of LCP/RCP is detected to generate the difference in reflectivity. After each experiment, a blank buffer was used to wash the cavity. Figures 2(b) and 2(c) show the experimental results of the prepared chiral molecule solution, in which the difference in reflectivity is positive and negative for R-structure molecules (R-MTX and R-ADP) and S-structure molecules (S-MTX and S-ADP), respectively. Its absolute value increased linearly with the concentration of chiral molecules, with correlation coefficients of 0.0044 ± 0.0002/−0.0046 ± 0.0003 mL · mg−1 for R-/S-ADP and 0.0030 ± 0.0001/−0.0032 ± 0.0001 mL · mg−1 for R-/S-MTX. Therefore, the experimental results of the prepared chiral molecule solution are consistent with the theoretical results. Moreover, the changing intensity of the light induced by the optical rotation for the ADP is 0.00084mL·mg1, indicating that the sensitivity of MCOC is over 5 times that of the optical rotation (see more details in Supplementary Material Section II).

    Experimental setup and the results of the prepared chiral molecule solution. (a) Schematic of the experimental setup, which consists of a combination of a half-wave plate (HWP) and a linear polarizer (LP), quarter-wave plates (QWPs), photoelectric detectors (PDs), MCOC, and a microsyringe system. (b), (c) Experimental results of R-/S-MTX and the R-/S-ADP molecule solution with different concentrations.

    Figure 2.Experimental setup and the results of the prepared chiral molecule solution. (a) Schematic of the experimental setup, which consists of a combination of a half-wave plate (HWP) and a linear polarizer (LP), quarter-wave plates (QWPs), photoelectric detectors (PDs), MCOC, and a microsyringe system. (b), (c) Experimental results of R-/S-MTX and the R-/S-ADP molecule solution with different concentrations.

    In the following section, we will use the experimental results shown in Figs. 2(b) and 2(c) as the calibration data to detect the changing concentrations of different chiral R/S-MTX and R/S- ADP in the cell culture experiment and animal experiments, respectively.

    The application of different concentrations of chiral drugs and treatment times has varied influences on cell proliferation. First, B16 cells were co-incubated with different concentrations of chiral drugs (S-MTX or R-MTX) for 24, 48, and 72 h. As shown in Fig. 3(b), the CCK-8 assay revealed that the chiral drug S-MTX had an obvious inhibitory effect on cell proliferation in the concentration range from 0.1μmol·L1 to 100μmol·L1, and this effect became more evident with increasing time compared with the behavior of the control group. This indicates that S-MTX exhibits concentration-dependent and time-dependent suppressive effects on B16 cell growth. In contrast, R-MTX only showed distinct cytostatic effects on B16 cells in the concentration range of 10100μmol·L1, and the relative viability of cells declined slowly over time. In comparison, the inhibitory effect of S-MTX was significantly more effective than that of R-MTX.

    Effect of chiral MTX on cell growth and cell viability. (a) B16 (XX) cells were cultured with S-/R-MTX at a concentration of 100 µmol·L-1. After 1, 2, 3, 6, 12, and 24 h of culture, the culture medium and intracellular fluid were sampled to detect changes in the concentration (see Section 4). (b) Varying cell viability of B16 cells co-incubated with different concentrations of chiral drugs (S-MTX or R-MTX) at 24, 48, and 72 h; (c) fluorescence microscopy observation of B16 cells stained with AM/PI after incubation with chiral drugs for 3, 6, and 12 h; (d) various concentrations of S-/R-MTX in culture medium with different culture durations.

    Figure 3.Effect of chiral MTX on cell growth and cell viability. (a) B16 (XX) cells were cultured with S-/R-MTX at a concentration of 100 µmol·L-1. After 1, 2, 3, 6, 12, and 24 h of culture, the culture medium and intracellular fluid were sampled to detect changes in the concentration (see Section 4). (b) Varying cell viability of B16 cells co-incubated with different concentrations of chiral drugs (S-MTX or R-MTX) at 24, 48, and 72 h; (c) fluorescence microscopy observation of B16 cells stained with AM/PI after incubation with chiral drugs for 3, 6, and 12 h; (d) various concentrations of S-/R-MTX in culture medium with different culture durations.

    After adding chiral drugs and incubating for various durations, B16 cells were stained with AM/PI for fluorescence microscope observation, as shown in Fig. 3(c). Strong green fluorescence of living B16 cells was observed in the control group. Similarly, the B16 cells incubated with chiral drugs for 3 h remained alive and looked similar to those in the control group. When the incubation time was extended to 6 h, the green fluorescence of B16 cells decreased, and red fluorescence began to appear. After incubation for 12 h, the red fluorescence appeared in abundance, while the green fluorescence decreased significantly. In addition, the number of intact cells in the visual field was reduced, which means that the growth of cells was significantly suppressed. Moreover, observing cell morphology under an inverted microscope at different time points showed that after the application of chiral drugs, cells fused, and some cells became round and floated, which showed a significant difference between S-MTX and R-MTX at 6 h. With increasing time, the cell membrane broke and thickened, and a large number of floating cell fragments appeared, especially in the S-MTX group (see more details in Supplementary Material Section III). These phenomena are consistent with previous results, confirming that MTX has an inhibitory effect on B16 cells and that large variability exists between different chiral drugs.

    Figure 3(d) presents the changes in S-/R-MTX concentrations in a culture medium, showing that the concentration of S-MTX decreased faster than that of R-MTX. The concentration decreased quickly after the addition of chiral drugs, and the absorption rate gradually decreased as the duration increased. Ultimately, the concentration in culture medium tended toward stability. Moreover, different concentrations of S-/R-MTX in a culture medium can be detected by our device, indicating the ability to perform monitoring.

    Figure 4(a) shows the preparation of the samples in the hypertension model (see more details in Supplementary Material Section IV). A hypertension model was successfully established via induction with L-NAME in Wistar rats after 3 weeks, which can be proven by systolic/diastolic blood pressure over 140/90 mmHg compared to normotensive rats. The effect of the administration of chiral ADP on hypertensive rats is shown in Fig. 4(c). The results showed that management with S-ADP (10mg·kg1) inhibited the rise in blood pressure with a mean change in systolic blood pressure of 53.00±6.42mmHg (mean ± SD) in such a way that there was no significant difference in systolic blood pressure compared to the normotensive group after 12 h (see more details in Supplementary Material Section V). In particular, blood pressure drops more sharply in the third hour. In contrast, R-ADP had little effect on high blood pressure, and the systolic blood pressure was maintained at approximately 163.00±3.67mmHg (mean ± SD), as shown in Fig. 4(d). Notably, there was a significant difference between S-ADP and R-ADP after 3 h, as shown in Fig. 5. S-ADP caused a gradual decrease in systolic blood pressure toward normal values, and the blood pressure-related heart rate was almost identical to that of the normal group. R-ADP provided little relief from high blood pressure and kept the heart rate slower. Figure 4(b) shows the changing R-/S-ADP concentration in the blood after tail vein injection. The results show that the concentration of ADP decreased sharply in the first 3 h, and the metabolism gradually decreased. The concentration of S-ADP remaining in blood was higher than that of R-ADP, indicating that S-ADP is metabolized more slowly and can exert sustained effects on blood pressure.

    Preventive effect of chiral ADP on hypertension. (a) Wistar rats were dosed with L-NAME for 3 weeks to establish a hypertension model. After that, they were divided into three groups, the control group, the S-ADP group, and the R-ADP group, which were administered blank buffer, S-ADP solution, and R-ADP solution, respectively. Then, we collected blood samples in different periods and detected their chiral ADP concentrations. (b) Changing R-/S-ADP concentration in the blood after tail vein injection; (c) changes in blood pressure and heart rate in the S-ADP group; (d) changes in blood pressure and heart rate in the R-ADP group.

    Figure 4.Preventive effect of chiral ADP on hypertension. (a) Wistar rats were dosed with L-NAME for 3 weeks to establish a hypertension model. After that, they were divided into three groups, the control group, the S-ADP group, and the R-ADP group, which were administered blank buffer, S-ADP solution, and R-ADP solution, respectively. Then, we collected blood samples in different periods and detected their chiral ADP concentrations. (b) Changing R-/S-ADP concentration in the blood after tail vein injection; (c) changes in blood pressure and heart rate in the S-ADP group; (d) changes in blood pressure and heart rate in the R-ADP group.

    Contrast between the results of S-ADP and R-ADP.

    Figure 5.Contrast between the results of S-ADP and R-ADP.

    Figure 5 shows the contrast between the results of S-ADP and R-ADP, in which S-ADP and R-ADP are different in the inhibition of hypertension, and S-ADP has a significant suppressive effect on hypertension. These results are consistent with the measured change in ADP concentration.

    3. Conclusion

    In conclusion, we proposed a new method to discern chiral enantiomers based on MCOC. The properties of our device were demonstrated both in cell and animal experiments, and the concentration of two pairs of chiral drugs was detected experimentally. As shown in Table 1, the proposed method realizes high sensitivity and a simple system structure, making it ideal for applications that require high-sensitivity chirality detection with simple and miniaturized devices. With our device, the changing concentrations of chiral drugs can be quickly monitored by all-optical means without complex sample preparation and high-cost chiral columns, which offers a novel method for achieving crucial chirality discrimination for pharmacokinetics and pharmacodynamics and presents opportunities in indicating the health status of humans.

    Ref.StructureMechanismAccuracy
    OursMCOCUOMs resonance0.245 mmol/L
    [27]Ultraviolet–circular dichroismCircular dichroism4.31 mmol/L
    [28]Hollow-center optical fiberOptical rotation0.3 mmol/L
    [29]Chiral molecules split lightReflection and refraction4.89 mmol/L
    [30]Continuous-wave cavity-enhanced polarimetryOptical rotation1.52 mmol/L

    Table 1. Comparison of Other Optical Chirality Detection Methods

    4. Methods and Materials

    Cell cultures. B16 mouse melanoma cells were purchased from Procell (Procell Life Science & Technology Co., Ltd., China). B16 cells were cultured in RPMI-1640 medium (Gibco, Life Technologies, Carlsbad, CA, USA) with 10% FBS and 1% penicillin–streptomycin in an incubator (37°C, 5% CO2).

    Study of proliferation and cell viability in vitro. To evaluate the proliferation of chiral drugs (S-MTX or R-MTX) in B16 cells, a Cell Counting Kit 8 assay (CCK-8, Dojindo, Japan) was initially performed. Briefly, B16 cells were seeded into 96-well plates at a density of 1×10⁴ cells/well and cultured overnight. Subsequently, 200 µL fresh medium with different concentrations of chiral drugs (0.1, 1, 10, 100) was added by removing the old medium, and the cells were then incubated for 24, 48, and 72 h. CCK-8 was used according to standard protocols, and the absorbance values were detected at 450 nm with a microplate reader (TECAN Infinite 200 PRO). The relative cell viability (%) was calculated, viability (%) = [(AsAb)/(AcAb)] × 100%, where As is the absorbance of the experimental well containing the cell culture medium, CCK-8, and the substance to be tested; Ab is the absorbance of a blank well, without the cell culture medium, CCK-8, and substance; Ac is the absorbance of the control group, containing the cell culture medium and CCK-8 without the substance to be tested.

    For analysis of cell viability, B16 cells were seeded on 24-well plates (1×10⁵ cells per well) and cultivated for 24 h. Afterward, the medium was removed and replaced with a fresh complete medium containing chiral drugs. At specific time points (3, 6, and 12 h), the cells were stained with calcein-AM/PI (2 mmol/L/4 µmol/L) and incubated in the dark for 20–40 min. The images of live/dead staining were photographed utilizing a fluorescence microscope (IX73, Olympus, USA).

    Evaluation of cellular morphology. To study the changes in cell morphology, B16 cells were first seeded onto 12-well plates (1×10⁵ cells per well) overnight. Next, the cells were grown in a medium containing chiral drugs after removing the old medium. After incubation for specific time periods (1, 2, 3, 6, 12, and 24 h), the cell morphology was visualized by a fluorescence microscope (IX73, Olympus, USA).

    Animals. Wistar rats (male, 180–200 g) were obtained from SLAC Laboratory Animal Co., Ltd. (Shanghai, China). All animal experiments were performed following protocols approved by the Ethical Committee for Animal Experiments of Shanghai Jiao Tong University (China, A2023043).

    Vacuum evaporation of Ag film. After ultrasonic cleaning, the parallel flat glass microcavity was coated with 300 nm Ag film on the bottom surface and 30 nm Ag film on the top surface to form an MCOC in a vacuum coater (Beijing Technol Science Co., Ltd., China). The purity of the Ag used in vacuum evaporation (Zhongnuo Xincai, China) should be higher than 99.99%.

    Establishment of the hypertension model. Wistar rats underwent adaptive rearing for 7 days before starting the experiment. Then, a solution of L-NAME (Nω-nitro-L-arginine methyl ester) was intragastrically administered (20 mg/kg) to normotensive rats, and high-salt water (4% NaCl solution) was consumed. After that, blood pressure was measured at an interval of 3 days. After 3 weeks, the hypertension model was successfully established when the systolic/diastolic blood pressure was consistently over 140/90 mmHg, and the rats were randomly divided into two groups. Chiral drugs (10 mg/kg) were injected intravenously via the tail vein, and blood was obtained with orbital puncture.

    Statistical analysis. All data are presented as the mean ± standard deviation (SD). The between-group differences in the test were analyzed by t-test (2-tailed) using Prism (Version 6, GraphPad Software), and the statistical significance was indicated as *p<0.05, **p<0.01, ***p<0.001, and ****p<0.0001.

    References

    [1] J. Arsuaga, M. Vazquez, P. Mcguirk et al. DNA knots reveal a chiral organization of DNA in phage capsids. Proc. Natl. Acad. Sci. U.S.A., 102, 9165(2005).

    [2] V. Goldanskii, V. V. Kuzmin. Chirality, and cold origin of life. Nature, 352, 114(1991).

    [3] G. Albano, G. Pescitelli, L. D. Bari. Chiroptical properties in thin films of π-conjugated systems. Chem. Rev., 120, 10145(2020).

    [4] S. Masataka, S. Tomojisa, C. Sayako et al. Host-microbe cross-talk governs amino acid chirality to regulate survival and differentiation of B cells. Sci. Adv., 7, eabd6480(2021).

    [5] A. J. Hutt, S. C. Tan. Drug chirality and its clinical significance. Drugs, 52, 1(1996).

    [6] L. A. Nguyen, H. He, C. Pham-Huy. Chiral drugs: an overview. Int. J. Biomed Sci., 2, 85(2006).

    [7] I. Čorić, B. List. Asymmetric spiroacetalization catalysed by confined Brønsted acids. Nature, 483, 315(2012).

    [8] M. E. Franks, G. R. Macpherson, W. D. Figg. Thalidomide. Lancet, 363, 1802(2004).

    [9] F. Kamarei, P. Vajda, F. Gritti et al. The adsorption of naproxen enantiomers on the chiral stationary phase (R,R)-whelk-O1 under supercritical fluid conditions. J. Chromatogr. A, 1345, 200(2014).

    [10] D. J. Cordato, L. E. Mather, G. K. Herkes. Stereochemistry in clinical medicine: a neurological perspective. J. Clin. Neurosci., 10, 649(2003).

    [11] B. S. Sekhon. Exploiting the power of stereochemistry in drugs: an overview of racemic and enantiopure drugs. J. Modern Med. Chem., 1, 10(2013).

    [12] V. K. Valev, J. J. Baumberg, C. Sibilia et al. Chirality and chiroptical effects in plasmonic nanostructures: fundamentals, recent progress, and outlook. Adv. Mater., 25, 2517(2013).

    [13] B. Frank, X. Yin, M. Schäferling et al. Large-area 3D chiral plasmonic structures. ACS Nano, 7, 6321(2013).

    [14] H. Takechi, O. Arteaga, J. M. Ribo et al. Chiroptical measurement of chiral aggregates at liquid-liquid interface in centrifugal liquid membrane cell by Mueller matrix and conventional circular dichroism methods. Molecules, 16, 3636(2011).

    [15] E. Castiglioni, S. Abbate, G. Longhi. Experimental methods for measuring optical rotatory dispersion: survey and outlook. Chirality, 23, 711(2011).

    [16] Y. Tang, A. E. Cohen. Enhanced enantioselectivity in excitation of chiral molecules by superchiral light. Science, 332, 333(2011).

    [17] C. Helgert, E. Pshenay-Severin, M. Falkner et al. Chiral metamaterial composed of three-dimensional plasmonic nanostructures. Nano Lett., 11, 4400(2011).

    [18] M. Esposito, V. Tasco, F. Todisco et al. Tailoring chiro-optical effects by helical nanowire arrangement. Nanoscale, 7, 18081(2015).

    [19] A. L. Nafie. Applications of Vibrational Optical Activity(2011).

    [20] I. W. Wainer, R. M. Stiffin, T. Shibata. Resolution of enantiomeric aromatic alcohols on a cellulose tribenzoate high-performance liquid chromatography chiral stationary phase: a proposed chiral recognition mechanism. J. Chromatogr. A, 411, 139(1987).

    [21] Q. Wei, H. Dai, H. Shan et al. All-photonic synapse based on iron-doped lithium niobate double metal-cladding waveguides. Phys. Rev. B, 104, 235308(2021).

    [22] H. Li, Z. Cao, H. Lu et al. Free-space coupling of a light beam into a symmetrical metal-cladding optical waveguide. Appl. Phys. Lett., 83, 2757(2003).

    [23] H. Dai, C. Yin, Z. Xiao et al. White beam lasing from a hybrid microcavity with slab-capillary mode coupling. Phys. Rev. Appl., 11, 064055(2019).

    [24] Y. Wang, Z. Cao, T. Yu et al. Enhancement of the superprism effect based on the strong dispersion effect of ultrahigh-order modes. Opt. Lett., 33, 1276(2008).

    [25] H. Dai, L. Yuan, C. Yin et al. Direct visualizing the spin Hall effect of light via ultrahigh-order modes. Phys. Rev. Lett., 124, 053902(2020).

    [26] Y. Zheng, W. Yuan, X. Chen et al. Wideband slow-light modes for time delay of ultrashort pulses in symmetrical metal-cladding optical waveguide. Opt. Express, 20, 9409(2012).

    [27] L. Chen, Y. J. Zhao, F. Gao et al. Determination of enantiomeric excess using the ultraviolet–circular dichroism and the high-performance liquid chromatography–circular dichroism methods. Appl. Spectrosc., 57, 797(2003).

    [28] T. C. Preston, N. D. Jones, S. Stille et al. Simple liquid-core waveguide polarimetry. Appl. Phys. Lett., 89, 253509(2006).

    [29] A. Ghosh, P. Fischer. Chiral molecules split light: reflection and refraction in a chiral liquid. Phys. Rev. Lett., 97, 173002(2006).

    [30] D. B. A. Tran, K. M. Manfred, R. Peverall et al. Continuous-wave cavity-enhanced polarimetry for optical rotation measurement of chiral molecules. Anal. Chem., 93, 5403(2021).

    Qiheng Wei, Xueqian Wang, Hongrui Shan, Yi Lai, He Li, Hailang Dai, Xianfeng Chen, "Chirality discerning and monitoring in a metal cladding optofluidic chip," Chin. Opt. Lett. 22, 081202 (2024)
    Download Citation