
Qiheng Wei, Xueqian Wang, Hongrui Shan, Yi Lai, He Li, Hailang Dai, Xianfeng Chen, "Chirality discerning and monitoring in a metal cladding optofluidic chip," Chin. Opt. Lett. 22, 081202 (2024)
- Chinese Optics Letters
- Vol. 22, Issue 8, 081202 (2024)
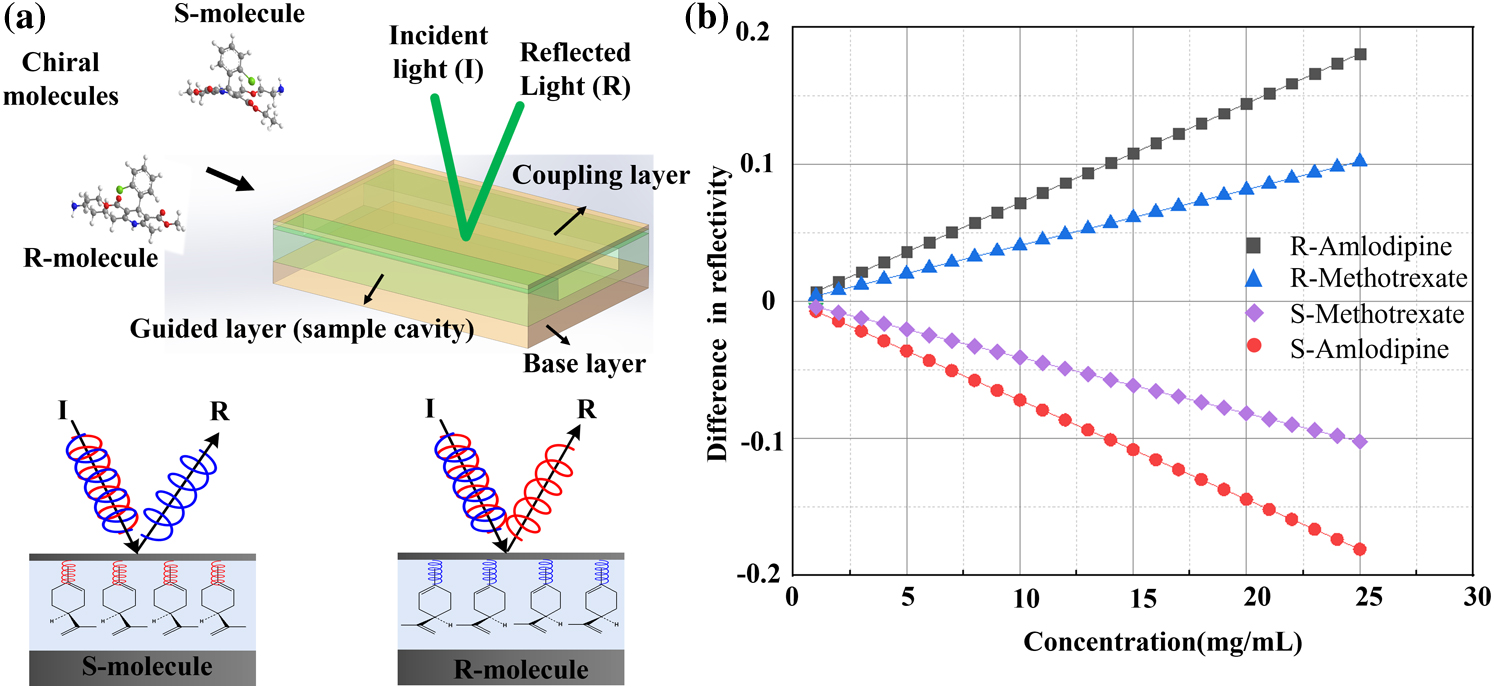
Fig. 1. Schematic of the MCOC and the discerning process. (a) The MCOC consists of a coupling layer, a guided layer (containing cavity), and a base layer. When chiral molecules with different chirality are injected into the cavity, the reflected beam is altered. For example, the R-limonene molecules exhibit high reflectivity for left-handed circularly polarized lasers, while S-limonene exhibits high reflectivity for right-handed circularly polarized lasers. (b) Theoretical results of the difference in reflectivity.

Fig. 2. Experimental setup and the results of the prepared chiral molecule solution. (a) Schematic of the experimental setup, which consists of a combination of a half-wave plate (HWP) and a linear polarizer (LP), quarter-wave plates (QWPs), photoelectric detectors (PDs), MCOC, and a microsyringe system. (b), (c) Experimental results of R-/S-MTX and the R-/S-ADP molecule solution with different concentrations.
Fig. 3. Effect of chiral MTX on cell growth and cell viability. (a) B16 (XX) cells were cultured with S-/R-MTX at a concentration of 100 µmol·L-1. After 1, 2, 3, 6, 12, and 24 h of culture, the culture medium and intracellular fluid were sampled to detect changes in the concentration (see Section 4). (b) Varying cell viability of B16 cells co-incubated with different concentrations of chiral drugs (S-MTX or R-MTX) at 24, 48, and 72 h; (c) fluorescence microscopy observation of B16 cells stained with AM/PI after incubation with chiral drugs for 3, 6, and 12 h; (d) various concentrations of S-/R-MTX in culture medium with different culture durations.
Fig. 4. Preventive effect of chiral ADP on hypertension. (a) Wistar rats were dosed with L-NAME for 3 weeks to establish a hypertension model. After that, they were divided into three groups, the control group, the S-ADP group, and the R-ADP group, which were administered blank buffer, S-ADP solution, and R-ADP solution, respectively. Then, we collected blood samples in different periods and detected their chiral ADP concentrations. (b) Changing R-/S-ADP concentration in the blood after tail vein injection; (c) changes in blood pressure and heart rate in the S-ADP group; (d) changes in blood pressure and heart rate in the R-ADP group.
Fig. 5. Contrast between the results of S-ADP and R-ADP.
|
Table 1. Comparison of Other Optical Chirality Detection Methods


Set citation alerts for the article
Please enter your email address

© Copyright 2018-2021 | Chinese Laser Press. All Rights Reserved 沪ICP备15018463号-20