• Chinese Journal of Quantum Electronics
  • Vol. 41, Issue 3, 522 (2024)
YANG Nan1,*, CHENG Tianle2, SHI Guangyuan1, PI Yuxin1, and CUI Minchao1
Author Affiliations
  • 1Key Laboratory of High Performance Manufacturing for Aero Engine, Ministry of Industry and Information Technology, Northwestern Polytechnical University, Xi'an 710072, China
  • 2School of Mechanical Engineering, Northwestern Polytechnical University, Xi'an 710072, China
  • show less
    DOI: 10.3969/j.issn.1007-5461.2024.03.014 Cite this Article
    Nan YANG, Tianle CHENG, Guangyuan SHI, Yuxin PI, Minchao CUI. Effect of hardness of TC4 titanium alloy samples on laser‐induced plasma temperature[J]. Chinese Journal of Quantum Electronics, 2024, 41(3): 522 Copy Citation Text show less
    Six samples after heat treatment and inlay
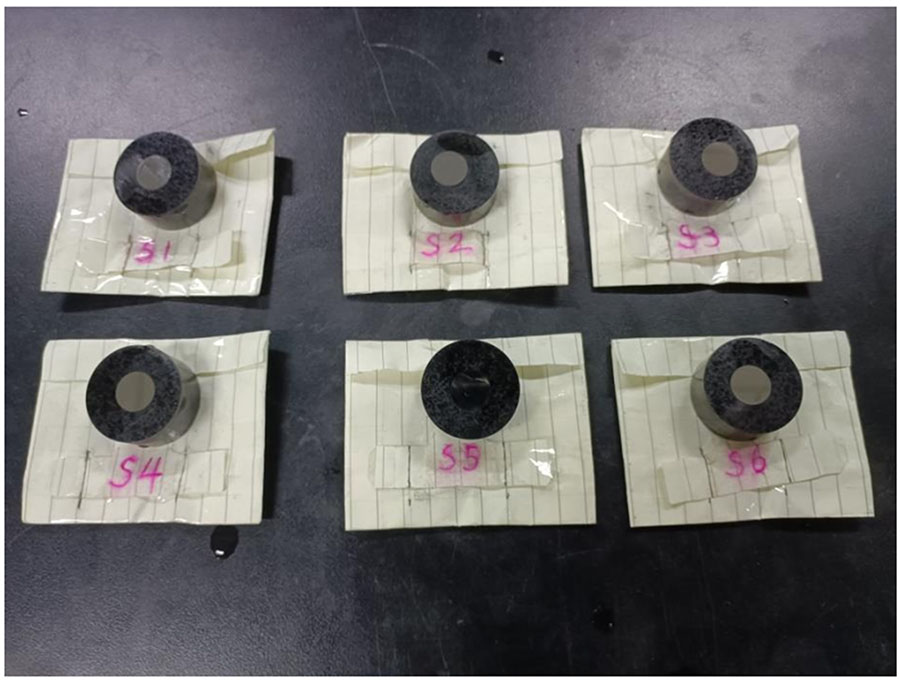
    Fig. 1. Six samples after heat treatment and inlay
    Schematic diagram of the LIBS experimental setup for TC4 titanium alloy detection
    Fig. 2. Schematic diagram of the LIBS experimental setup for TC4 titanium alloy detection
    Timing diagram of laser-induced plasma radiation spectrum
    Fig. 3. Timing diagram of laser-induced plasma radiation spectrum
    LIBS pulse laser ablation crater on the surface of the sample. (a) Macroscopic schematic diagram of ablation crater;(b) Microscopic schematic diagram of ablation crater
    Fig. 4. LIBS pulse laser ablation crater on the surface of the sample. (a) Macroscopic schematic diagram of ablation crater;(b) Microscopic schematic diagram of ablation crater
    Spectral line intensity of Al versus the hardness for 6 samples. (a) Al Ⅱ 281.619 nm; (b) Al Ⅰ 396.152 nm
    Fig. 5. Spectral line intensity of Al versus the hardness for 6 samples. (a) Al Ⅱ 281.619 nm; (b) Al Ⅰ 396.152 nm
    Spectral intensity ratio of Al Ⅱ 281.619 nm and Al Ⅰ 396.152 nm for 6 samples
    Fig. 6. Spectral intensity ratio of Al Ⅱ 281.619 nm and Al Ⅰ 396.152 nm for 6 samples
    Spectral intensity ratio of Al Ⅱ 281.619 nm and Al Ⅰ 396.152 nm versus the hardness of TC4 samples
    Fig. 7. Spectral intensity ratio of Al Ⅱ 281.619 nm and Al Ⅰ 396.152 nm versus the hardness of TC4 samples
    Boltzmann plots of 6 TC4 titanium alloy samples with different hardness. (a) S1; (b) S2; (c) S3; (d) S4; (e) S5; (f) S6
    Fig. 8. Boltzmann plots of 6 TC4 titanium alloy samples with different hardness. (a) S1; (b) S2; (c) S3; (d) S4; (e) S5; (f) S6
    Plasma excitation temperatures versus the hardness of TC4 samples
    Fig. 9. Plasma excitation temperatures versus the hardness of TC4 samples
    ElementMass fraction/%
    Al5.50~6.75
    V3.50~4.50
    Fe0.30
    C0.08
    N0.05
    H0.015
    O0.20
    Other0.40
    TiBal.
    Table 1. Chemical compositions of TC4 titanium alloy
    SampleThermal treatmentNano-indentation hardness/GPa
    S1780 oC, Annealing4.025
    940 oC , Solution treatment
    S2780 oC, Annealing4.269
    940 oC, Solution treatment
    550 oC, Aging treatment
    S3780 oC, Annealing4.413
    940 oC, Solution treatment
    650 oC, Aging treatment
    S4780 oC, Annealing4.564
    940 oC, Solution treatment
    600 oC, Aging treatment
    S5780 oC, Annealing4.787
    S6780 oC, Annealing4.834
    940 oC, Solution treatment
    500 oC, Aging treatment
    Table 2. Hardness values of the TC4 titanium alloy samples
    λmn/nmEm/eVgmAmn/ (108 s-1)
    Al Ⅱ 207.40116.57471.41
    Al Ⅱ 281.61911.82213.57
    Al Ⅱ 308.85217.27050.11
    Al Ⅱ 358.65615.30392.35
    Al Ⅱ 466.30613.25630.58
    Table 3. Spectral parameters of Al II characteristic spectral lines[21]
    Nan YANG, Tianle CHENG, Guangyuan SHI, Yuxin PI, Minchao CUI. Effect of hardness of TC4 titanium alloy samples on laser‐induced plasma temperature[J]. Chinese Journal of Quantum Electronics, 2024, 41(3): 522
    Download Citation