Author Affiliations
1School of Resources and Environmental Engineering, Anhui University, Hefei 230601, Anhui, China2Institute of Spacecraft System Engineering, Beijing 100094, China3Information Materials and Intelligent Sensing Laboratory of Anhui Province, Hefei 230601, Anhui, China4Anhui Engineering Research Center for Geographical Information Intelligent Technology, Hefei 230601, Anhui, Chinashow less
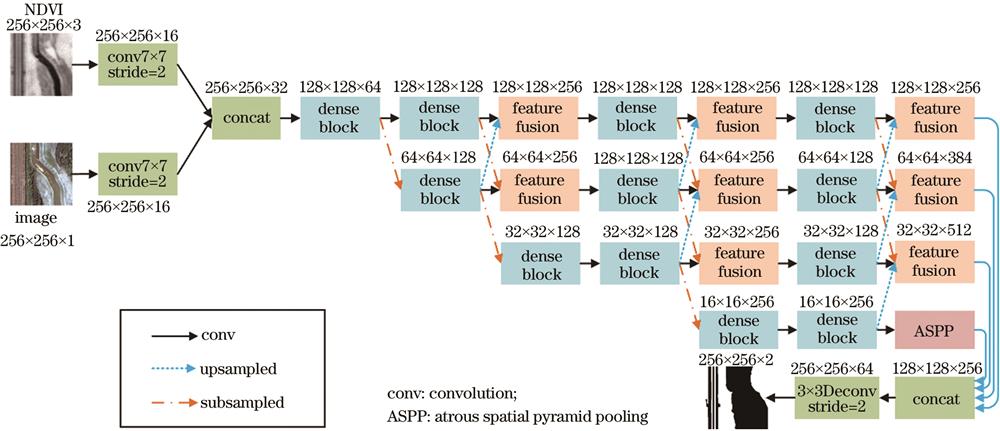
Fig. 1. Flow chart of network structure
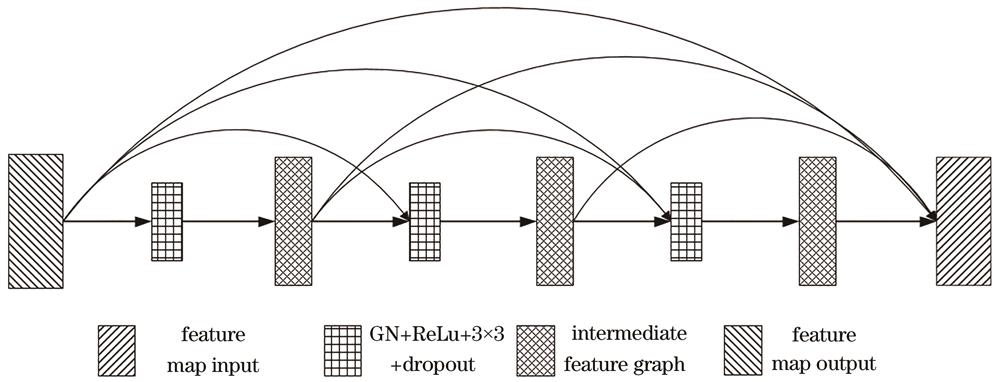
Fig. 2. Dense blocks
Fig. 3. Atrous spatial pyramid pooling (ASPP) block
Fig. 4. Multiresolution feature fusion modes. (a) Mode 1); (b) mode 2); (c) mode 3)
Fig. 5. Example of vegetation samples from remote sensing images
Fig. 6. City classification results before and after HRDN joined NDVI
Fig. 7. Rural classification results before and after HRDN joined NDVI
Fig. 8. Result map of vegetation classification in urban areas by HRDN, Deeplab-V3+, BiseNet, and DCCN
Fig. 9. Result map of vegetation classification in rural areas by HRDN, Deeplab-V3+, BiseNet, and DCCN
Fig. 10. Result map of vegetation classification and extraction by proposed method
| Use | Sample | Model testing | Universal validation 1 | Universal validation 2 |
|---|
| Sensor | GF2-PMS2 | GF2-PMS2 | GF6-PMS | GF2-PMS2 | | Region | Hefei | Hefei | Hefei | Beijing | | Spatial resolution /m | 1 | 1 | 2 | 1 | | Image acquisition date | 2015-08-03 | 2016-08-27 2015-08-03 | 2018-10-04 | 2016-08-27 | | Midline coordinates | E117.3,N31.7 | E116.8,N40.4 E117.3,N31.7 | E117.4,N32.1 | E116.8,N40.4 |
|
Table 1. Image parameters
| Region | Image | Cultivated land | Grassland | Forest | Aquatic vegetation | Mean F1 score | Mean IOU | OA |
|---|
| F1 | IOU | F1 | IOU | F1 | IOU | F1 | IOU |
|---|
| City | Image 1 | 14.53 | 9.01 | 18.22 | 10.02 | 63.33 | 46.33 | / | / | 32.03 | 21.79 | 87.02 | | Image 2 | 15.67 | 8.50 | 13.59 | 7.29 | 67.49 | 50.93 | 67.28 | 50.70 | 41.01 | 29.36 | 89.79 | | Image 3 | / | / | 12.44 | 6.63 | 90.27 | 82.27 | / | / | 51.36 | 44.45 | 94.88 | | Image 4 | / | / | 14.94 | 8.07 | 83.56 | 71.77 | / | / | 49.25 | 39.92 | 93.90 | | All images | 15.10 | 8.76 | 14.80 | 8.00 | 76.16 | 62.83 | 67.28 | 50.70 | 43.41 | 33.88 | 91.40 | | Rural | Image 5 | 89.05 | 80.26 | 87.80 | 78.26 | 79.20 | 65.56 | 78.07 | 64.02 | 83.53 | 72.03 | 78.49 | | Image 6 | 86.19 | 75.74 | 81.89 | 69.33 | 77.21 | 62.87 | 77.32 | 63.03 | 80.65 | 67.74 | 77.90 | | Image 7 | 86.71 | 76.54 | 84.44 | 73.07 | 80.99 | 68.05 | 80.68 | 67.61 | 83.21 | 71.32 | 82.60 | | Image 8 | 72.08 | 56.35 | 70.97 | 55.00 | 61.11 | 44.00 | 60.68 | 43.11 | 66.21 | 49.62 | 61.16 | | All images | 83.51 | 72.22 | 81.28 | 68.92 | 74.63 | 60.12 | 74.19 | 59.44 | 78.40 | 65.18 | 75.04 | | (a) | | Region | Image | Cultivated land | Grassland | Forest | Aquatic vegetation | Mean F1 score | Mean IOU | OA | | F1 | IOU | F1 | IOU | F1 | IOU | F1 | IOU | | City | Image 1 | 53.23 | 36.27 | 57.49 | 40.34 | 82.45 | 70.14 | / | / | 64..39 | 48.92 | 93.48 | | Image 2 | 56.02 | 38.91 | 62.31 | 45.25 | 84.5 | 96.56 | 84.48 | 73.12 | 71.83 | 63.46 | 94.79 | | Image 3 | / | / | 77.61 | 63.42 | 98.34 | 96.73 | / | / | 87.98 | 80.08 | 99.25 | | Image 4 | / | / | 75.32 | 60.41 | 97.87 | 95.83 | / | / | 86.60 | 78.12 | 99.38 | | All images | 54.63 | 37.59 | 68.18 | 52.36 | 90.79 | 89.82 | 84.48 | 73.12 | 82.14 | 67.65 | 96.73 | | Rural | Image 5 | 90.60 | 82.82 | 88.58 | 79.50 | 85.49 | 74.66 | 84.82 | 73.64 | 87.37 | 77.66 | 87.20 | | Image 6 | 94.33 | 89.27 | 92.50 | 86.05 | 91.71 | 84.69 | 91.67 | 84.62 | 92.55 | 86.16 | 93.08 | | Image 7 | 94.34 | 89.29 | 93.14 | 87.16 | 92.52 | 86.08 | 92.43 | 85.93 | 93.11 | 87.11 | 94.41 | | Image 8 | 88.29 | 79.04 | 86.44 | 76.12 | 89.03 | 80.23 | 88.59 | 79.52 | 88.09 | 78.73 | 90.70 | | All images | 91.89 | 85.11 | 90.17 | 82.21 | 89.69 | 81.42 | 89.38 | 80.93 | 90.28 | 82.41 | 91.35 | | (b) |
|
Table 2. Comparison of classification accuracy of HRDN before and after adding NDVI. (a), (b) are classification accuracies of fused NDVI model and unfused NDVI model, respectively
| Image 1 | Cultivated land | Grassland | Forest | Aquatic vegetation | UA /% |
|---|
| Cultivated land | 47.35 | 2.22 | 1.21 | / | 60.95 | | Grassland | 8.52 | 56.64 | 4.45 | / | 60.33 | | Forest | 33.24 | 31.31 | 85.02 | / | 90.84 | | Aquatic vegetation | 0 | 0 | 0.01 | / | 0 | | PA /% | 47.35 | 56.64 | 85.02 | / | | | Kappa:84.50% | | (a) | | Image 2 | Cultivated land | Grassland | Forest | Aquatic vegetation | UA /% | | Cultivated land | 58.62 | 6.73 | 0.14 | 0 | 53.63 | | Grassland | 6.47 | 60.63 | 2.87 | 27.66 | 66.91 | | Forest | 31.86 | 28.72 | 93.15 | 1.1 | 84.63 | | Aquatic vegetation | 0 | 0.02 | 0.02 | 67.26 | 58.37 | | PA /% | 58.62 | 60.63 | 93.15 | 67.26 | | | Kappa:85.85% | | (b) | | Image 3 | Cultivated land | Grassland | Forest | Aquatic vegetation | UA /% | | Cultivated land | / | 0 | 0 | / | 0 | | Grassland | / | 81.38 | 0.42 | / | 79.97 | | Forest | / | 18.43 | 99.56 | / | 98.68 | | Aquatic vegetation | / | 0.12 | 0.20 | / | 0 | | PA /% | / | 81.38 | 99.35 | / | | | Kappa:98.37% | | (c) | | Image 4 | Cultivated land | Grassland | Forest | Aquatic vegetation | UA /% | | Cultivated land | / | 0.37 | 0.14 | / | 0 | | Grassland | / | 85.08 | 1.09 | / | 70.40 | | Forest | / | 14.16 | 97.89 | / | 99.47 | | Aquatic vegetation | / | 0.05 | 0.01 | / | 0 | | PA /% | / | 85.08 | 97.89 | / | | | Kappa:98.29% | | (d) |
|
Table 3. Confusion matrices of images in urban areas. (a)-(d) are confusion matrices of four images in urban area respectively
| Image 5 | Cultivated land | Grassland | Forest | Aquatic vegetation | UA /% |
|---|
| Cultivated land | 87.51 | 2.00 | 8.14 | 27.34 | 93.92 | | Grassland | 2.03 | 25.05 | 2.18 | 0.71 | 11.80 | | Forest | 7.85 | 60.66 | 80.87 | 22.70 | 77.96 | | Aquatic vegetation | 0.27 | 4.65 | 0.54 | 42.39 | 66.73 | | PA /% | 87.51 | 25.05 | 80.87 | 42.39 | | | Kappa:80.61% | | (a) | | Image 6 | Cultivated land | Grassland | Forest | Aquatic vegetation | UA /% | | Cultivated land | 94.71 | 16.74 | 5.90 | 1.09 | 93.96 | | Grassland | 0.67 | 37.79 | 0.53 | 0.23 | 53.04 | | Forest | 4.47 | 36.79 | 92.50 | 7.27 | 88.87 | | Aquatic vegetation | 0.06 | 0.24 | 0.42 | 89.87 | 92.32 | | PA /% | 94.71 | 37.79 | 92.5 | 89.87 | | | Kappa:90.05% | | (b) | | Image 7 | Cultivated land | Grassland | Forest | Aquatic vegetation | UA /% | | Cultivated land | 93.51 | 7.65 | 5.32 | 0.96 | 95.19 | | Grassland | 0.20 | 70.67 | 1.55 | 0.08 | 52.67 | | Forest | 5.41 | 18.45 | 91.74 | 9.61 | 91.76 | | Aquatic vegetation | 0.24 | 0.09 | 0.16 | 86.54 | 85.99 | | PA /% | 93.51 | 70.67 | 91.74 | 86.54 | | | Kappa:91.78% | | (c) | | Image 8 | Cultivated land | Grassland | Forest | Aquatic vegetation | UA /% | | Cultivated land | 88.8 | 40.70 | 6.01 | 13.83 | 87.79 | | Grassland | 0.14 | 26.37 | 0.24 | 0.26 | 70.91 | | Forest | 10.19 | 29.37 | 93.22 | 15.85 | 89.07 | | Aquatic vegetation | 0.68 | 0.71 | 0.26 | 69.53 | 83.87 | | PA /% | 88.8 | 26.37 | 93.22 | 69.53 | | | Kappa:86.23% | | (d) |
|
Table 4. Confusion matrices of images in rural areas. (a)-(d) are confusion matrices of four images in rural areas respectively
| Region | Image | Cultivated land | Grassland | Forest | Aquatic vegetation | Mean F1 score | Mean IOU | OA |
|---|
| F1 | IOU | F1 | IOU | F1 | IOU | F1 | IOU |
|---|
| City | Image 1 | 39.60 | 24.69 | 36.60 | 22.40 | 79.31 | 65.72 | / | / | 51.84 | 37.60 | 92.48 | | Image 2 | 55.19 | 38.11 | 38.50 | 23.84 | 80.10 | 66.80 | 80.06 | 66.74 | 63.46 | 48.87 | 93.32 | | Image 3 | / | / | 30.68 | 18.12 | 92.60 | 86.21 | / | / | 61.64 | 52.17 | 95.77 | | Image 4 | / | / | 35.37 | 21.48 | 91.17 | 83.77 | / | / | 63.27 | 52.63 | 96.23 | | All images | 47.40 | 31.40 | 35.29 | 21.46 | 85.99 | 75.80 | 80.06 | 66.74 | 60.05 | 46.21 | 94.45 | | Rural | Image 5 | 90.00 | 81.81 | 89.19 | 80.49 | 85.50 | 74.67 | 84.72 | 73.49 | 87.35 | 78.99 | 85.96 | | Image 6 | 91.47 | 84.29 | 90.07 | 81.93 | 88.35 | 79.13 | 88.40 | 79.21 | 89.57 | 81.14 | 88.57 | | Image 7 | 87.98 | 78.54 | 86.66 | 76.46 | 85.10 | 74.07 | 85.00 | 73.92 | 86.19 | 75.75 | 87.53 | | Image 8 | 77.59 | 63.39 | 76.95 | 62.46 | 79.12 | 65.46 | 78.57 | 64.70 | 70.06 | 64.00 | 78.92 | | All images | 86.76 | 77.01 | 85.71 | 75.34 | 84.52 | 73.33 | 84.17 | 72.83 | 83.29 | 74.97 | 85.25 | | (a) | | Region | Image | Cultivated land | Grassland | Forest | Aquatic vegetation | Mean F1 score | Mean IOU | OA | | F1 | IOU | F1 | IOU | F1 | IOU | F1 | IOU | | City | Image 1 | 0 | 0 | 35.99 | 21.94 | 67.16 | 50.56 | / | / | 51.57 | 36.25 | 88.42 | | Image 2 | 0 | 0 | 35.52 | 21.59 | 68.77 | 52.41 | 68.72 | 52.35 | 57.67 | 42.12 | 90.36 | | Image 3 | / | / | 67.95 | 51.45 | 92.84 | 86.64 | / | / | 80.40 | 69.05 | 95.64 | | Image 4 | / | / | 51.00 | 34.23 | 89.86 | 81.59 | / | / | 70.43 | 57.91 | 95.91 | | All images | 0 | 0 | 47.62 | 32.30 | 79.66 | 67.80 | 68.72 | 52.35 | 65.337 | 50.82 | 92.58 | | Rural | Image 5 | 90.43 | 82.53 | 89.68 | 81.30 | 85.86 | 75.22 | 84.84 | 73.66 | 87.70 | 78.17 | 86.48 | | Image 6 | 91.13 | 83.71 | 89.70 | 81.33 | 86.79 | 76.67 | 86.65 | 76.44 | 88.57 | 79.54 | 87.43 | | Image 7 | 89.73 | 81.37 | 88.01 | 78.59 | 86.30 | 75.91 | 85.89 | 75.28 | 87.48 | 77.79 | 88.13 | | Image 8 | 80.86 | 67.86 | 80.05 | 66.73 | 81.63 | 68.97 | 80.95 | 67.99 | 80.87 | 67.89 | 82.27 | | All images | 88.04 | 78.87 | 86.86 | 76.99 | 85.15 | 74.19 | 84.58 | 73.34 | 86.16 | 75.85 | 86.08 | | (b) | | Region | Image | Cultivated land | Grassland | Forest | Aquatic vegetation | Mean F1 score | Mean IOU | OA | | F1 | IOU | F1 | IOU | F1 | IOU | F1 | IOU | | City | Image 1 | 16.53 | 9.01 | 18.22 | 10.02 | 63.32 | 46.33 | / | / | 32.69 | 21.79 | 87.02 | | Image 2 | 15.67 | 8.50 | 13.59 | 7.29 | 67.49 | 50.93 | 67.28 | 50.70 | 41.01 | 29.36 | 89.79 | | Image 3 | / | / | 12.44 | 6.63 | 90.27 | 82.27 | / | / | 51.36 | 44.45 | 94.88 | | Image 4 | / | / | 14.94 | 8.07 | 83.56 | 71.77 | / | / | 49.25 | 39.92 | 93.90 | | All images | 16.51 | 8.76 | 14.80 | 8.00 | 76.16 | 62.83 | 67.28 | 50.70 | 43.58 | 33.88 | 91.40 | | Rural | Image 5 | 89.05 | 80.26 | 87.80 | 78.26 | 79.20 | 65.56 | 78.07 | 64.02 | 83.53 | 72.03 | 78.49 | | Image 6 | 86.19 | 75.74 | 81.89 | 69.33 | 77.21 | 62.87 | 77.32 | 63.03 | 80.65 | 67.74 | 77.90 | | Image 7 | 86.71 | 76.54 | 84.44 | 70.07 | 80.99 | 68.05 | 80.68 | 67.61 | 83.21 | 70.57 | 82.60 | | Image 8 | 72.08 | 56.35 | 70.97 | 55.00 | 61.11 | 44.00 | 60.25 | 43.11 | 66.10 | 49.62 | 61.16 | | All images | 83.51 | 72.22 | 81.28 | 68.17 | 74.63 | 60.12 | 74.08 | 59.44 | 78.37 | 70.11 | 75.04 | | (c) |
|
Table 5. Classification results of three methods. (a), (b), (c) are classification and extraction results of Deeplab-V3+, BiseNet, and DCCN models, respectively
| Region | Cultivated land | Grassland | Forest | Aquatic vegetation | Mean F1 score | Mean IOU | OA | Kappa |
|---|
| F1 | IOU | F1 | IOU | F1 | IOU | F1 | IOU |
|---|
GF-6 Hefei image 1 | 89.04 | 80.24 | 85.99 | 75.42 | 84.60 | 73.30 | 84.17 | 72.66 | 86.53 | 75.41 | 88.42 | 82.97 | GF-6 Hefei image 2 | 59.79 | 42.64 | 62.56 | 45.51 | 84.22 | 72.74 | 84.17 | 72.67 | 72.69 | 58.39 | 93.55 | 84.14 | GF-2 Beijing image 1 | 89.08 | 80.31 | 86.63 | 76.41 | 88.89 | 80.00 | 88.64 | 79.60 | 88.31 | 79.08 | 88.95 | 82.78 | GF-2 Beijing image 2 | 71.40 | 55.52 | 64.89 | 48.03 | 85.82 | 75.17 | 85.71 | 75.00 | 76.95 | 63.43 | 92.41 | 83.32 |
|
Table 6. Extraction accuracy of vegetation classification by proposed method