• Journal of Inorganic Materials
  • Vol. 39, Issue 9, 1053 (2024)
Jia CHEN, Yiran FAN, Wenxin YAN, and Yingchao HAN*
Author Affiliations
  • State Key Laboratory of Advanced Technology for Materials Synthesis and Processing, Wuhan University of Technology, Wuhan 430070, China
  • show less
    DOI: 10.15541/jim20230596 Cite this Article
    Jia CHEN, Yiran FAN, Wenxin YAN, Yingchao HAN. Polyacrylate-calcium (cerium) Nanocluster Fluorescent Probes for Quantitative Detection of Inorganic Phosphorus[J]. Journal of Inorganic Materials, 2024, 39(9): 1053 Copy Citation Text show less
    Morphology, size and structure of PAA-Ca(Ce) nanofluorescent probe
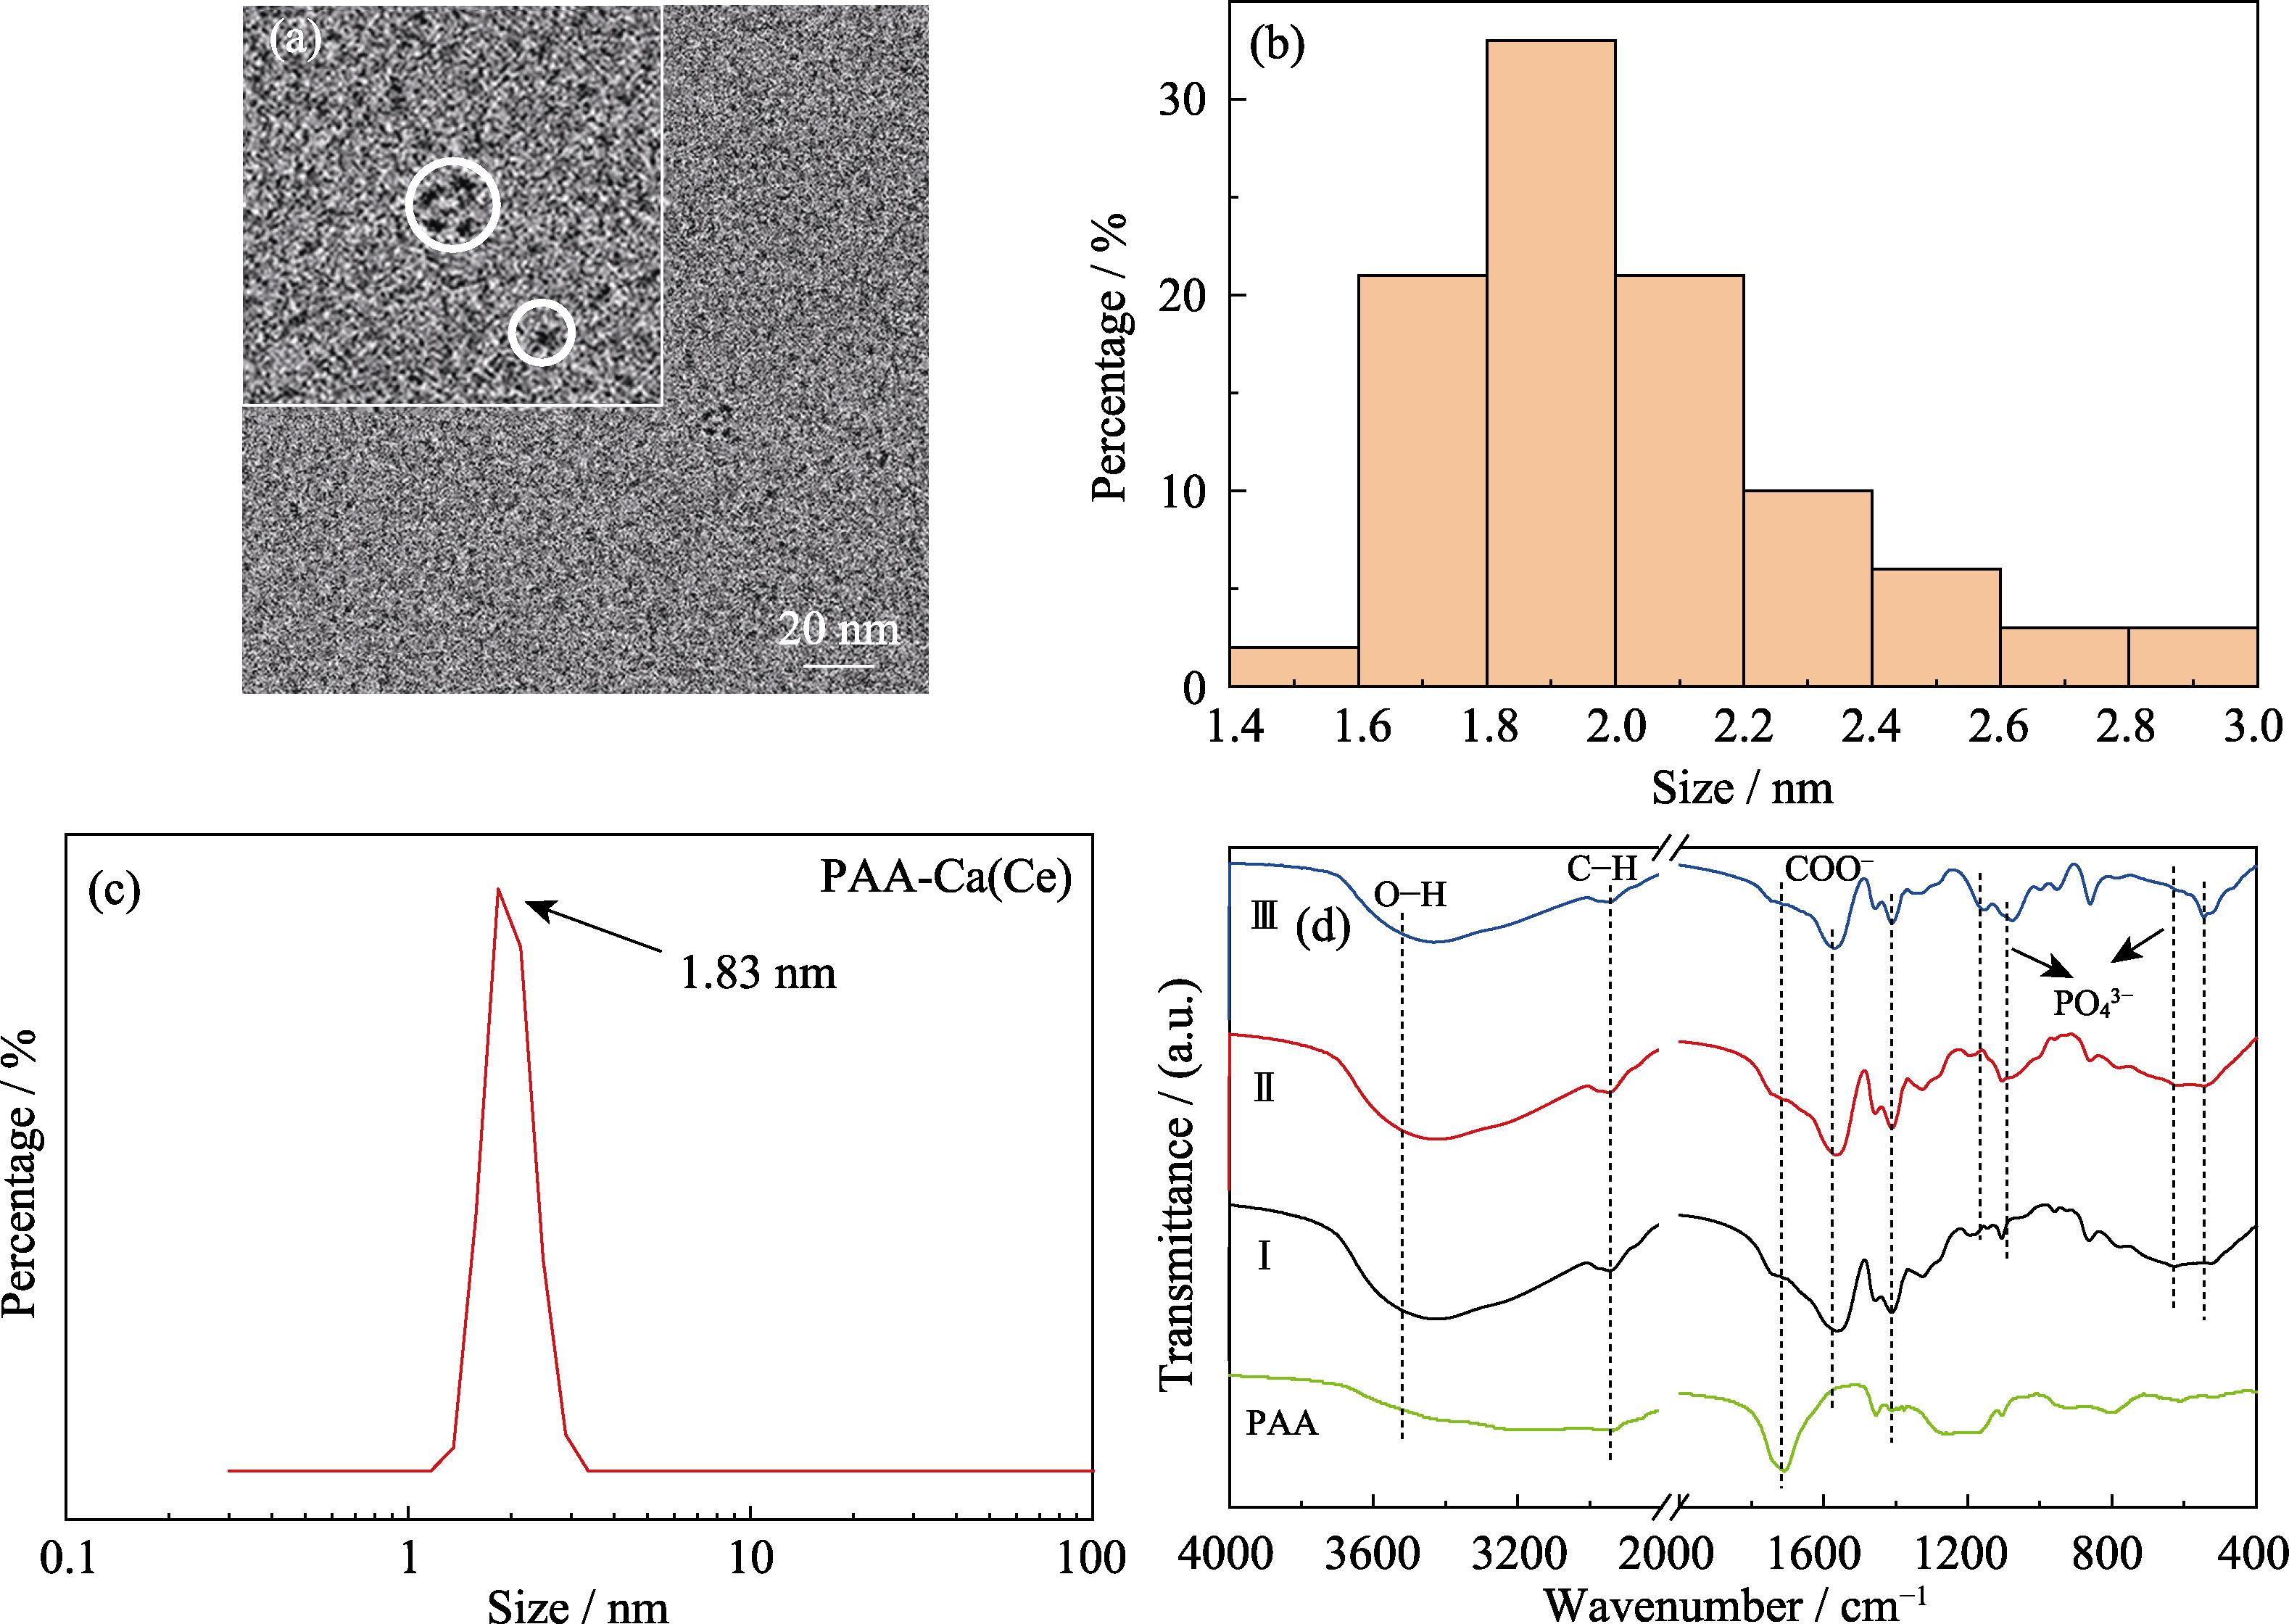
    1. Morphology, size and structure of PAA-Ca(Ce) nanofluorescent probe
    Fluorescence stability of PAA-Ca(Ce) nanofluorescent probe for PO43-
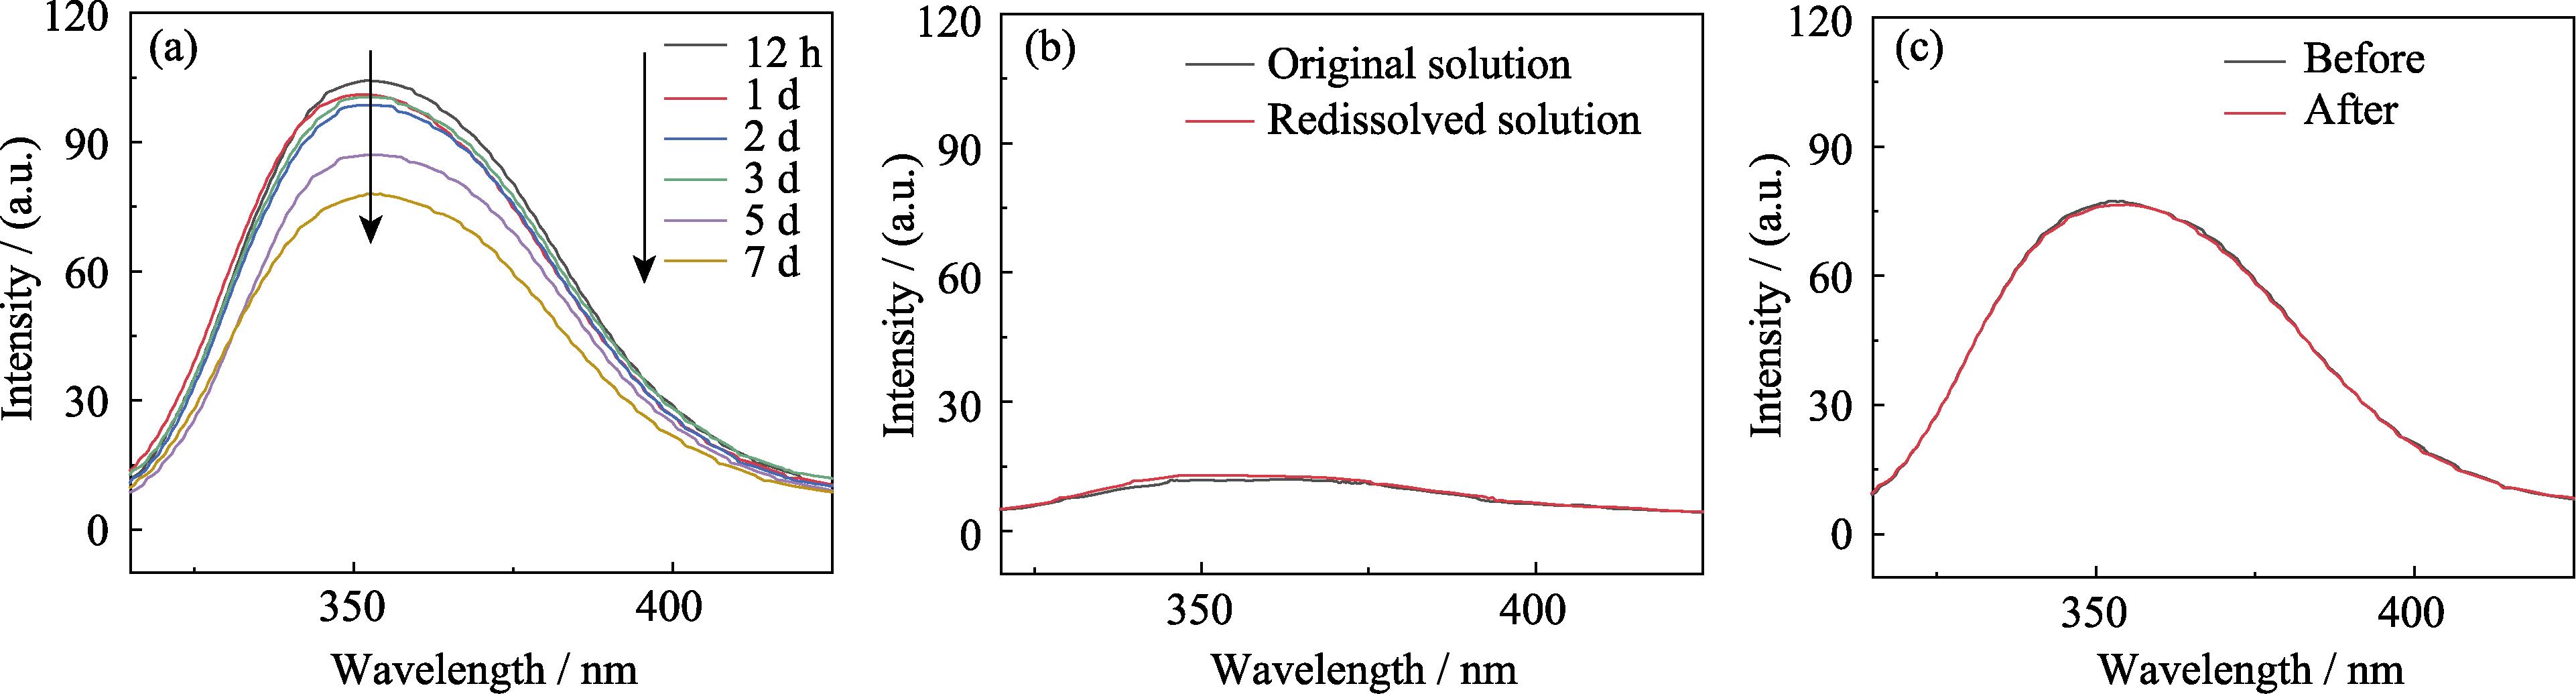
    2. Fluorescence stability of PAA-Ca(Ce) nanofluorescent probe for PO43-
    Fluorescence emission spectra of the reaction products between PAA-Ca(Ce) fluorescent probes and PO43- with different concentrations of (Ca2++Ce3+), and corresponding linear relationship of PO43- concentration-fluorescence intensity
    3. Fluorescence emission spectra of the reaction products between PAA-Ca(Ce) fluorescent probes and PO43- with different concentrations of (Ca2++Ce3+), and corresponding linear relationship of PO43- concentration-fluorescence intensity
    Relationship between PO43- concentration and fluorescence intensity at low PO43-concentration
    4. Relationship between PO43- concentration and fluorescence intensity at low PO43-concentration
    Influence of reaction time and temperature on fluorescence intensity
    5. Influence of reaction time and temperature on fluorescence intensity
    Relationship between instrument response value and PO43- concentration
    6. Relationship between instrument response value and PO43- concentration
    Influence of different chemical environmental factors on PAA-Ca(Ce) nano-fluorescent probes
    7. Influence of different chemical environmental factors on PAA-Ca(Ce) nano-fluorescent probes
    Schematic of fluorescence probe method for sensing PO43-
    8. Schematic of fluorescence probe method for sensing PO43-
    PO43- added /(mmol·L-1) FP methodMARSP
    PO43- detected/(mmol·L-1) Recovery/% PO43- detected/(mmol·L-1) Recovery/%
    109.63396.3269.09690.962
    2020.611103.05618.69493.472
    3028.85696.18626.63488.780
    4040.009100.02237.71994.299
    5048.63497.26947.77995.559
    6060.304100.50755.13491.891
    7068.46297.80266.39194.844
    8079.15998.94975.19193.989
    9087.96497.73787.08096.755
    100100.526100.52694.50594.505
    110110.024100.02299.92890.844
    120116.61497.178115.24996.041
    130131.590101.223122.93494.564
    140139.34899.534125.77589.839
    150145.31896.879140.96193.974
    160161.331100.832156.50097.813
    170171.033100.608164.87696.986
    180176.63098.128170.58894.771
    190191.582100.832178.27093.826
    200198.96699.483196.27598.138
    Average recovery (mean±SD)/%99.155±1.88094.093±2.566
    Table 1. Recovery of PO43- detected by fluorescence probe (FP) method in contrast to that by molybdenum-antimony resistance spectrophotometry (MARSP)
    SampleFP methodMARSPp value
    12.6482.5520.9626
    22.3752.451
    32.5992.604
    Average±SD2.541±0.1192.536±0.064
    Table 2. Determination of PO43- in mouse serum
    Jia CHEN, Yiran FAN, Wenxin YAN, Yingchao HAN. Polyacrylate-calcium (cerium) Nanocluster Fluorescent Probes for Quantitative Detection of Inorganic Phosphorus[J]. Journal of Inorganic Materials, 2024, 39(9): 1053
    Download Citation