 AI Video Guide
  AI Picture Guide
 AI One Sentence

P. Hesselbach, J. Lütgert, V. Bagnoud, R. Belikov, O. Humphries, B. Lindqvist, G. Schaumann, A. Sokolov, A. Tauschwitz, D. Varentsov, K. Weyrich, B. Winkler, X. Yu, B. Zielbauer, D. Kraus, D. Riley, Zs. Major, P. Neumayer. Platform for laser-driven X-ray diagnostics of heavy-ion heated extreme states of matter[J]. Matter and Radiation at Extremes, 2025, 10(1): 017803
- Matter and Radiation at Extremes
- Vol. 10, Issue 1, 017803 (2025)
Note: This section is automatically generated by AI . The website and platform operators shall not be liable for any commercial or legal consequences arising from your use of AI generated content on this website. Please be aware of this.
Abstract
I. INTRODUCTION
Matter at high energy density (HED), most commonly defined by an energy density above 100 J/mm3 (or 1 Mbar of pressure), is ubiquitous throughout the universe, making up most of the matter inside compact astrophysical objects, such as (giant) planets, brown dwarfs, and stars. The theoretical description of matter under these conditions, in particular of the so-called warm-dense-matter (WDM) regime, with densities around and above solid density and at electron-volt temperatures, remains a great challenge, since the potential energy between the ions, the electrochemical potential, and chemical bonding and ionization energies are all comparable to the thermal energy. WDM thus constitutes a strongly coupled, partially degenerate, partially ionized plasma. Predicting material properties such as the equation of state, phase boundaries, ionization, and optical and transport properties, which are important prerequisites for modeling, for example, planetary structure and evolution,1 requires computationally intensive quantum many-particle calculations.2 Understanding these complex states of matter is also of crucial importance for applications such as inertial confinement fusion, where the fusion fuel has to pass through the WDM regime.3
Producing samples under HED conditions in the laboratory allows for experimental testing of models of these extreme states of matter. This is enabled by powerful drivers capable of delivering energy to small volumes on short timescales. Pulsed power machines have been used to accelerate flyer plates for shock compression to megabar pressures,4 or for radiative heating to temperatures relevant to the study of solar opacities.5 Large-scale laser facilities produce pressures of tens of megabars or gigabars via hohlraum-driven planar6 or spherical7 compression, as well as direct laser shock compression.8 Ultrashort X-ray pulses from X-ray free-electron lasers, focused to few-micrometer spot sizes, have been used to isochorically heat samples within femtoseconds to highly transient out-of-equilibrium states with temperatures up to 100 eV.9
Pulses of swift heavy ions offer an interesting alternative approach to reach HED conditions. High-energy ions passing through matter lose energy predominantly through electronic stopping, i.e., transferring energy to electrons in the sample via Coulomb collisions. The range of heavy ions such as lead or uranium with energies of several hundred MeV/u is of the order of millimeters in matter at solid density. This opens a unique pathway to the production of large (cubic millimeter-sized) and homogeneous WDM samples by volumetric heating.10
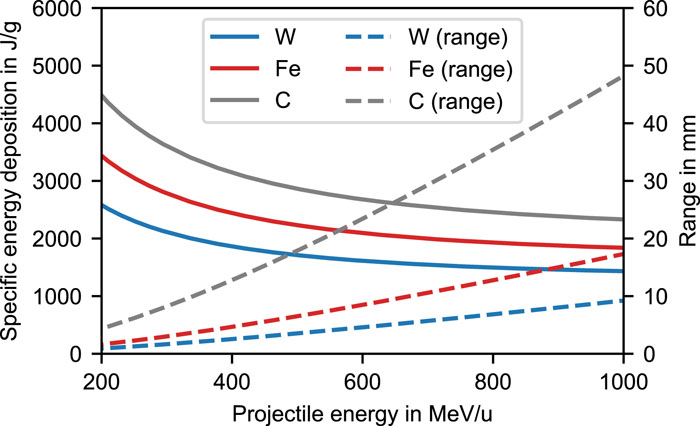
At the international Facility for Antiproton and Ion Research in Europe GmbH (FAIR), currently under construction at the GSI Helmholtzzentrum für Schwerionenforschung GmbH near Darmstadt, Germany, the new heavy-ion synchrotron SIS100 is envisaged to deliver pulses of relativistic heavy ions at unprecedented intensities, reaching up to several 1011 uranium ions per pulse.11 A strong emphasis of the FAIR science program is on exploring the quantum chromodynamic (QCD) phase diagram, exotic nuclei involved in astrophysical nucleosynthesis processes, and fundamental symmetries.12 A further focus lies on extreme matter research in atomic and plasma physics and on application-oriented research in biophysics, medical physics, and materials science, to all of which the future APPA cave is dedicated. For experiments in HED science, a set of large-bore superconducting focusing magnets will allow focusing of the relativistic heavy-ion beams to sub-millimeter spot sizes.13 To illustrate the potential for volumetric heating, Fig. 1 shows the specific energy deposition of 1010 uranium ions, focused to a Gaussian spot with a diameter of 1 mm (FWHM). With the intensities expected at FAIR, HED conditions with temperatures in the electron-volt range can be reached. Several schemes have been proposed, for example, to generate high-entropy states in the region around the critical point of metals14 or to produce conditions like those found in planetary interiors by low-entropy compression.15,16 The international collaboration HED@FAIR is coordinating the development of the scientific case and the experimental infrastructure to leverage these upcoming new capabilities for HED science.17
![]()
Figure 1.Energy deposition and range of uranium ions as a function of projectile energy in different materials (W, Fe, and C), calculated with SRIM.
With the new facility still under construction, important current activities are the commissioning of experimental hardware, testing of detectors, and validation of new experimental approaches and schemes. These activities are pursued within the ongoing FAIR Phase-0 research program, using the existing GSI infrastructure. In this paper, we report on the commissioning activities at the newly upgraded high-energy, high-temperature (HHT) experimental station at GSI dedicated to the preparation for the first HED experiments.
This paper is structured as follows. In Sec. II, we describe the experimental infrastructure at the HHT cave after recent upgrade activities. Sections III and IV are dedicated to explaining the diagnostics used to characterize the ion-beam focus and for the spatially resolved pyrometric temperature measurements of the heavy-ion heating. Section V gives a more detailed account of the X-ray backlighting capabilities afforded by the new high-energy laser beamline to the cave and the X-ray diagnostics that have been commissioned. In Sec. VI, we discuss measures against background on our diagnostics that are of particular importance in the high-radiation environment of the heavy-ion beam. Finally, Sec. VII presents an outlook on future plans and developments.
II. HHT EXPERIMENTAL AREA AT GSI
The HHT experimental area at GSI is dedicated to plasma physics research. It is located downstream of the SIS18 heavy-ion synchrotron, which has been upgraded in preparation for injection into the future SIS100 ring of FAIR.19 The characteristics of the ion bunches available in the HHT cave cover a wide range in terms of ion species, energy, and temporal structure. On the one hand, intense beams of protons or light ions with energies in the multi-GeV range can be used as a powerful diagnostics for ultrafast processes in dense matter using the unique PRIOR proton microscope.20,21
On the other hand, very intense and strongly focused beams of heavy-ion species (e.g., lead or uranium) at moderate energies of a few hundred MeV/u can efficiently generate HED states in solid-density samples by direct volumetric heating, as outlined in Sec. I. By extracting all ions from the SIS18 synchrotron within one cycle, pulse durations around 1 μs are achieved. The temporal pulse shape can be chosen as a flat top or have a structure with a single or four bunches. The single bunch can be temporally compressed down to ∼100 ns (FWHM). For the data presented in this paper, we used single bunches with a duration of 250–300 ns (FWHM).
The HHT cave has recently been equipped with a laser beamline, connecting the cave with GSI’s high-energy laser facility, PHELIX, to allow for experiments combining the intense ion beams with energetic laser pulses. The laser beamline is designed to transport nanosecond laser pulses with energies up to 200 J at a wavelength of 527 nm (i.e., the second harmonic). More details on the architecture and performance of both the laser facility and the new laser beamline are described by Major et al.22 In addition, the target chamber designed for the future APPA cave has already now been installed at HHT (see Fig. 2). The vacuum chamber offers ample space (
![]()
Figure 2.The APPA target chamber on its support frame (dark gray) and the diagnostics table support (light gray). The incident PHELIX and heavy-ion beams are shown in green and pink, respectively.
Reaching HED conditions requires tight focusing of the ion beam, for example, to a focal spot size below 1 mm2. At HHT, for this purpose, a pair of large-aperture, normal-conducting quadrupole magnets is located immediately in front of the target chamber. Ion-optical calculations in previous design studies23 have shown that millimeter spot sizes can be achieved for ions with magnetic rigidity up to 10 Tm (e.g., U73+ at 350 MeV/u) over a focal length of up to 1 m. Consequently, the interaction point inside the new target chamber is positioned at a distance of ∼0.75 m from the exit of the final focusing magnet.
The ion-beam focal intensity distribution can be measured by imaging the optical light emitted, either from beam-induced fluorescence (BIF) of a background gas24 or from optical transition radiation (OTR) upon passage of the ions through a thin foil.25 In addition, the total number of ions is measured by means of absolutely calibrated resonant current transformers. Combining these measurements yields the in-focus ion fluence distribution, which allows calculating the specific energy deposition. Furthermore, the pulse duration and temporal structure of the ion bunch can be obtained by a fast current transformer.
To directly measure the temperature achieved by heavy-ion heating, two different setups for pyrometric temperature measurements have been implemented. Gated optical imaging allows for spatially resolved measurements of the thermal emission from the heated sample. In addition, single-point measurements can be performed with a fiber-based light-collection setup, providing time-resolved measurements at up to five different wavelengths (between 600 and 1550 nm), using an array of fast photodiodes. Full details of this setup are described by Belikov et al.26 We will describe ion-beam focal spot measurements and pyrometry measurements based on the imaging setup in Secs. III and IV, respectively.
The availability of high-energy laser pulses in the HHT cave enables probing of heavy-ion heated samples by state-of-the-art X-ray diagnostic techniques. In the commissioning beamtime reported here, we were able to demonstrate X-ray diffraction (XRD) and X-ray Thomson scattering (XRTS) from samples under ambient conditions, i.e., without ion-beam heating. The experimental setup shown in Fig. 3 is, however, arranged in a suitable way for future combined experiments. The samples, which are foils or thin slabs, are mostly oriented parallel to the incoming ion beam, which enters the target chamber through a 50 μm-thick titanium window.
![]()
Figure 3.Experimental setup: (a) schematic top view; (b) CAD drawing. The laser pulse is incident on the backlighter target to create X-rays for probing the sample. X-ray diagnostics are shown along with optical diagnostics: Monitor, monitor spectrometer; XRTS, X-ray Thomson scattering spectrometer; XRD, X-ray diffraction detector; F-pyro, fiber-optic pyrometry; Img. pyro, imaging pyrometry; BIF beam-induced fluorescence diagnostics; OTR, optical transition radiation diagnostics; Foc, laser focus diagnostics. In (b), only the first optic of each imaging setup is shown.
At the typical energies of the incoming ions of 300–450 MeV/u, the range of the ions exceeds the sample dimensions. Therefore, the Bragg peak does not lie within the sample, and homogeneous heating in the ion-beam direction is achieved. Another option is to slow down the incoming ions before the interaction to maximize the energy deposition. For this, a degrader (e.g., 15 mm of PMMA) is moved into the ion beam, as indicated in Fig. 3(a).
Several optical imaging lines are used to facilitate accurate alignment of the sample, imaging of BIF and OTR to position the ion-beam focus and measure its size and intensity distribution, and thermal imaging for pyrometric measurements. The PHELIX laser pulse is focused by means of an f = 1.8 m lens, located outside the target chamber, onto a backlighter target, using the imaging line opposite the incoming laser beam for alignment. X-rays emitted by the laser-generated hot plasma, located a few millimeters from the sample, are used for backlighting. A monitor spectrometer measures the X-ray yield and spectrum of the source on every shot. X-rays diffracted from the sample are detected using a well-shielded large-area detector, while the weak scattered radiation is spectrally resolved in a high-efficiency scattering spectrometer. The performance of the laser-driven X-ray source and the design of the X-ray diagnostics are described in Sec. V.
III. CHARACTERIZATION OF THE ION-BEAM FOCUS
To visualize the ion fluence distribution in the focus, we use the optical emission produced either from BIF of a background gas fill or OTR of a thin foil driven into the ion focus. The emission is imaged by two pairs of infinite-conjugate achromatic lenses with a diameter of 2 in. (∼5 cm) (Thorlabs ACT508-300-A/ACT508-1000-A and ACT508-250-A/ACT508-750-A). The first lens is located 250 or 300 mm from the image plane for efficient light collection, and the second lens forms an image with 3.3× or 3× magnification onto a gated intensified camera (PCO DiCam Pro), located on the optical breadboards outside the target chamber. We have experimentally determined the spatial resolution of these imaging setups by fitting an edge spread function to the image of a knife edge. We find a resolution of ∼30 μm (FWHM), which is mainly limited by the camera resolution. For all ion-beam focus measurements presented here, the exposure time was set to 500 ns.
For BIF at HHT, it was found suitable to flood the target chamber with argon gas at pressures of a few hundred millibars.24 On collision with the heavy ions, argon atoms are excited, ionized, or both, resulting in line emission of argon atoms and ions.27 Secondary electrons produced from these interactions can, in turn, collisionally excite or ionize argon atoms. As energetic secondary electrons might propagate out of the ion focus before the collision, it is beneficial to select line emission originating only from heavy-ion collisions. While there is a significant cross-section for simultaneous ionization and excitation by a single heavy-ion collision, this process is negligible in the case of electrons, thus favoring the choice of ionic line emission for measurements of the ion-beam fluence distribution. Furthermore, the lifetimes of excited ionic states are shorter than those of excited neutral states, namely, in the range of a few tens of nanoseconds compared with around 100 ns,28 eliminating broadening of the emitting volume due to thermal motion.
In argon, the strongest 4p–4s emission lines from neutral atoms (Ar I) are in the spectral range from 700 to 900 nm, while most of the emission from ionic argon (Ar II) lies in the spectral range from 400 to 500 nm. In our setup, we have therefore used interference bandpass filters (450 ± 40 nm, L.O.T.-Oriel) to spectrally select ionic line emission. The intensity-weighted lifetime of excited ionic states in this spectral range averages to
![]()
Figure 4.Focal measurements of the heavy-ion beam by BIF and OTR: (a) raw image of BIF; (b) raw image of OTR; (c) series of measurements with up to 4 × 109208Pb67+ ions at 300 MeV/u. The ion numbers refer to values measured with a resonant current transformer located at the entrance of the beamline and do not take into account further losses toward the sample. Note that the beam propagates in the
OTR occurs when a charged particle passes through a surface with a change in refractive index. As a consequence of the Maxwell equations of electromagnetism, the emission does not involve any atomic processes, and therefore grants direct access to the spatial distribution of the ion beam.
In our setup, we have implemented OTR measurements by placing a thin aluminum foil at an angle of 45° with respect to the ion beam (rotation around the vertical y-axis), using the side-view imaging line from the BIF measurements to obtain a direct image of the in-focus ion distribution. An example image is shown in Fig. 4(b). The main axes of the 2D Gaussian-like distribution align horizontally and vertically with the x- and y-axes, respectively, as expected from the orientation of the focusing quadrupoles. However, we also observe a number of bright “hot spots” that cannot be attributed to the ion beam. We speculate that these might be the result of the foil’s surface structure. In the future, we plan to use thin foils of carbon or graphene, which come with a significantly smoother surface and, in addition, can stand significantly higher fluences before melting.
Figure 4(c) shows the ion focal spot sizes (FWHM) in the x- and y-directions for different pulses of 208Pb67+ ions at 300 MeV/u obtained through OTR and BIF. The ion number measured with a resonant current transformer at the entrance of the beamline was varied from ∼0.5 × 10⁹ to the highest available ion number of ∼4 × 10⁹. In addition to a 5% statistical uncertainty in ion number, we estimate a statistical uncertainty of 5% for the widths measured by OTR. For the highest ion numbers, we have compared OTR and BIF. Because of the better image quality for the BIF measurements, we attribute a smaller statistical uncertainty of 2% to these measurements.
While in the y-direction, the OTR and BIF measurements agree within the statistical uncertainties, we observe a systematic difference in the x-direction. This can be explained by a systematic error in the orientation of the OTR foil. Assuming an uncertainty of ±5°, the gray bar in Fig. 4(c) indicates the resulting uncertainty in the FWHM measurement. Taking this into account, the widths determined by BIF and OTR are consistent within the errors. The data clearly show an increase in focal spot size with increasing particle number, which is due to the increase in phase space of the beam in the ring accelerator. For our calculations of the energy deposition and heating induced by the ion beam, a linear fit to the data is used. In Fig. 4(c), the shaded region indicates the uncertainty of this fit.
Given the total number of ions irradiating a sample and the fluence distribution in the focus, the specific energy deposited by the ion pulse can be calculated, using, for example, ion stopping powers from the SRIM software.18 From this, using the temperature-dependent heat capacity and enthalpy of fusion (and, if necessary, the enthalpies of solid-solid phase transitions) of the sample material, we can calculate the temperature increase from the heavy-ion heating. The heat capacities and enthalpies for iron, tantalum, and copper are taken from Desai29 and Arblaster,30,31 respectively. The heat capacity of copper is assumed to be constant above the melting point.
The aforementioned calculations can be used to predict the area across the sample where the temperature exceeds the melting temperature. This prediction can be compared with the holes found in a post-mortem analysis of the irradiated samples. For example, Fig. 5(a) shows our prediction (blue line) along with a scanning electron microscope (SEM) image of a 100 μm-thick tantalum plate after irradiation with (1.76 ± 0.18) × 109208Pb67+ ions. This ion number at the sample position takes the beamline transmission of τ = 0.8 ± 0.08 into account. The dashed blue lines show calculations in which the ion number is varied according to the uncertainty of the beamline transmission.
![]()
Figure 5.(a) SEM image of a 100 μm-thick tantalum plate after irradiation. For comparison, the solid blue ellipse indicates the area where the calculated temperature exceeds the melting temperature (3290 K). Dashed blue ellipses indicate the uncertainty due to the beamline transmission. The red and gray ellipses are explained in the text. Since the rotation of the foil in the SEM image is arbitrary, the ellipses are rotated to align with the hole. (b) Focal distribution of the corresponding ion-beam setting, measured separately by BIF. The ion number refers to values measured with a resonant current transformer located at the entrance of the beamline. The working point of (a) is marked by a dashed vertical line. The ellipses in (a) are enlarged in one direction because the tantalum plate was tilted at an angle of 45° with respect to the ion beam (rotation around the vertical
Further uncertainty to our prediction is due to heat conduction. For the blue-line predictions in Fig. 5(a), we have assumed that the enthalpy of fusion must be fully overcome by the initial energy deposition of the heavy ions. For comparison, the area between the solid blue and red lines in Fig. 5(a) (red hatching) indicates where the melting temperature is reached, but the enthalpy of fusion is not overcome entirely (here, the uncertainty of the beamline transmission is neglected). We expect this to be an upper limit on the enlargement of the hole by heat conduction. On the basis of our calculations, the more outward area between the red and gray lines (gray hatching) has
Although outside the scope of this paper, we note that a more detailed model for the hole size could be obtained by including heat conduction as well as the dynamics of the phase transition, the liquid material, and the process of solidification. We conclude that our simple model does not allow for measurements of the focal spot size of the heavy-ion beam by post-mortem analysis of the irradiated samples. Still, the hole size measurement is in agreement with our temperature calculation based on the fluence distribution measured by BIF and OTR. It furthermore confirms that, already with the ion-beam intensities currently available at HHT, samples can be heated to several thousand kelvin.
It should be noted that for the presented sample irradiation, we used a different ion-beam setting, namely, ions with 450 MeV/u were decelerated to 288 MeV/u by a 15 mm PMMA degrader according to SRIM18 simulations. The corresponding focal sizes measured by BIF are shown in Fig. 5(b). While the decelerated ion energy (and therefore the energy deposition in the sample) in this setting is comparable to the default 300 MeV/u, the higher initial ion energy allowed for a smaller focal spot and hence more heating overall.
IV. SPATIALLY RESOLVED PYROMETRIC TEMPERATURE MEASUREMENTS OF HEAVY-ION HEATED SAMPLES
Pyrometric measurements are desired as a standard diagnostics for experimental setups investigating heavy-ion heated matter at HHT. They are based on the spectral dependence of the thermal emission on temperature and wavelength as described by Planck’s radiation law. We installed a setup for imaging the thermal emission of the heated samples, enabling spatially resolved temperature measurements.
The setup consists of two achromatic lenses (Thorlabs ACT508-300-A) guiding the thermal emission outside the chamber. As shown in Fig. 6(a), this is followed by another set of achromatic lenses (Thorlabs AC254-150-A), dichroic beam splitters (Thorlabs DMLP605L) and silver mirrors (Thorlabs PF20-03-P01) to split the thermal emission into two channels. The images of the thermal emission in both channels are detected side by side on a gated, intensified CCD camera (PCO DiCam Pro).
![]()
Figure 6.(a) Schematic layout of the imaging system of the pyrometric setup outside the chamber, including the red channel of the experiment and an envisaged green channel. (b) Theoretical temperature dependence of the detected power in the two channels of (a) for black-body emission. If both channels are used, single-channel pyrometric measurements can be complemented by the ratio of the detected power, which allows direct inference of a gray-body temperature.
In one of the two channels, we installed a color filter (Thorlabs FB700-40) in the red wavelength range, transmitting from 680 to 720 nm, allowing for single-channel pyrometric measurements. The use of the second channel with a filter in the green wavelength range around 550 nm is planned in the near future. The sensitivity of the red channel was calibrated by a tungsten lamp with precisely known current-temperature dependence. On the short timescales of our experiment, the thermal emission detected in the red channel yields sufficient signal-to-noise levels from slightly below 2000 K upward. We expect accurate temperature measurements, owing to the strong dependence of the emitted and thus detected power on the temperature, as shown in Fig. 6(b). The black-body temperature directly extracted from the optical measurement is related to the real temperature of the sample taking into account emissivity data (see the Appendix).
Figure 7 shows a representative example of the background-corrected data detected with the pyrometric setup for a 100 μm-thick tantalum plate, tilted at an angle of 45° with respect to the ion beam and irradiated with (1.76 ± 0.18) × 109208Pb67+ ions degraded to 288 MeV/u [cf. Section III; see Fig. 5(b) for the focal distribution]. While the top half (y > 0) of the left image shows the detected signal, the corresponding temperatures are shown in the bottom half (y < 0) on the left. For comparison, we simulated the energy deposition of the heavy ions with SRIM18 and calculated the corresponding temperatures as described in Sec. III. The result is shown on the bottom right of Fig. 7 (y < 0). Similarly to Fig. 5(a), the area within the blue arc exceeds the melting temperature, while the area between the blue and red arc reaches the melting temperature but without overcoming the enthalpy of fusion. From the calculated temperature distribution on the bottom right of Fig. 7 (y < 0), we furthermore calculated the expected signal on the camera, which is shown on the top right of Fig. 7 (y > 0), by inverting the calibration of our pyrometric setup.
![]()
Figure 7.(left) Pyrometric measurement from a 100 μm-thick tantalum plate irradiated by (1.76 ± 0.18) × 109208Pb67+ ions [see the dashed line in
We find a decent agreement between the detected and expected signals in terms of signal strength, shape and spatial dimensions. However, our measurement implies temperatures up to 2000 K, even at large radii (r > 0.5 mm), where, according to our calculations, the sample should remain at ambient temperatures. Heat conduction cannot explain the observed broadening. This can be understood by approximating the temperature profile by a 2D Gaussian with a width given by the beam size and estimating ∂T/∂t = a
Instead, we believe the broadening observed in Fig. 7 is an artifact caused by the strong temperature dependence of the signal strength [see Fig. 6(b)]. Owing to the near-exponential increase of the radiance with temperature, together with the limited dynamic range of the camera, already low signals above the background correspond to a substantial temperature. Image blur due to a limited depth of focus or a pedestal in the point-spread function of the imaging system similar to the findings by Miller et al.34 could explain the apparent broadening of the heated area. While we plan to validate our hypotheses and improve the optical setup by using AR coatings or wedges in the future, here we will carry out a quantitative comparison between the measured and calculated temperatures, considering only the peak value in the center.
The center temperature of the heated area for shots on plates of different materials and at various ion numbers is shown in Fig. 8. We have adjusted the camera gain and exposure time to reach high signal strengths at the center of the heated area for each shot. Uncertainties in the measured temperatures therefore mainly come from the surface emissivity, for which we have assumed a relative error of 30% because of the lack of systematic data in the literature in our temperature and wavelength ranges, unknown surface conditions of our samples, and an oblique angle of view of the imaging pyrometer onto the sample surface. The used emissivities and their references can be found in the Appendix.
![]()
Figure 8.Pyrometrically measured (data points) and calculated (solid lines, with shaded areas indicating the uncertainties) center temperatures for different sample materials and different numbers of 208Pb67+ ions at 288 MeV/u [see
The lines in Fig. 8 indicating calculated temperature values show a region of constant temperature for each material where melting occurs. Uncertainties in the calculated temperatures are dominated by the uncertainty in the ion beamline transmission τ = 0.8 ± 0.08.
The trend of the measured temperatures matches the calculations well, although the measured values are systematically lower than the calculated values. For the tantalum data, which span the largest range of ion numbers, we find better agreement with lower ion numbers. This suggests a systematic overestimation of the energy deposition at high ion numbers due, for example, to a dependence of the beamline transmission on the ion number as the occupied phase space volume changes. Future work will focus on a precise measurement of the ion number just before the target chamber.
Nevertheless, we have demonstrated the suitability of our imaging pyrometer setup for spatially resolved temperature measurements of heavy-ion heated samples. Comparison with calculations shows good agreement regarding the peak temperature, while for the spatially resolved data, suitable signal thresholds must be applied.
V. LASER-DRIVEN X-RAY DIAGNOSTICS
X-ray-based diagnostics have become an indispensable tool for characterizing HED states of matter produced in the laboratory.35–39 Since X-rays with photon energies of some tens of keV can penetrate the dense and optically opaque samples, X-ray diagnostics are suited for volumetric probing. High-energy laser-produced plasmas provide sufficient X-ray flux to backlight the short-lived states and are widely used, for example, at large-scale laser facilities like the National Ignition Facility (NIF) or the OMEGA laser system. In addition, non-laser compression facilities have opted to build dedicated laser beamlines for the purpose of enabling laser-driven X-ray diagnostics.40 On the other hand, the exceptional X-ray beam characteristics of X-ray free-electron lasers motivated the setup of dedicated HED end stations (or “instruments”), featuring HED drivers such as high-energy or ultrahigh-intensity laser systems and pulsed magnetic fields.41,42
The wide variety of X-ray diagnostics enables measurements of macroscopic quantities such as mass density43 as well as probing of microscopic structure44,45 and other plasma parameters such as temperature,46 ionization state,47 and transport properties.48 X-ray radiography gives direct access to the mass density, allowing, for example, to monitor the rapid hydrodynamic evolution and to directly benchmark equation-of-state (EOS) models.43,49 X-ray diffraction (XRD) has been used to reveal solid-solid phase transitions by detecting the lattice structure44,45 and to infer the lattice temperature.50 Spectrally resolved X-ray Thomson scattering (XRTS) can probe the electron velocity distribution and density,46 ionization state,47 and plasmonic excitations.51
Given this important diagnostic potential, a high-energy laser beamline is planned for the APPA cave to enable state-of-the-art X-ray probing. In its first stage, this will be a 100 J-class, nanosecond-pulse laser beamline, capable of producing on-target intensities of
In our commissioning experiments at HHT, we aim to demonstrate the use of XRD and XRTS, both of which require intense narrow-band X-ray radiation at photon energies of a few keV. To realize the X-ray backlighter source, we have focused 2 ns long laser pulses of PHELIX with up to 200 J of energy at a wavelength of 527 nm under normal incidence onto a thin foil (“backlighter target”) using an f/13 lens. Reaching peak intensities of up to 1 × 10¹⁶ W/cm2, a hot, highly charged plasma is produced, emitting strong Heα line radiation. The backlighter target is located just a few millimeters from the sample to maximize the X-ray flux at the sample position.
The implemented monitor spectrometer, XRTS spectrometer, and XRD detector are presented in the following subsections, together with our results regarding the laser-driven X-ray emission and probing of ambient samples.
A. Monitor spectrometer
The X-ray spectrum emitted by the laser-produced plasma is measured by a monitor spectrometer. This allows the detection of possible changes in the source spectrum on a shot-to-shot basis and thus the verification that the required on-target laser intensities and energies are reached. Furthermore, it can be used to correct the signal (e.g., diffraction or scattering) for shot-to-shot fluctuations.
The spectrometer is based on a flat highly oriented pyrolytic graphite (HOPG) crystal (Optigraph GmbH, Berlin) with a thickness of 100 μm, together with an X-ray CCD camera (greateyes GE-VAC 2048 512 BI) as a detector. Both are mounted on an aluminum housing as shown in Fig. 9. The housing allows the distance between the crystal and the camera to be varied, changing the central photon energy between 4.5 and 6 keV. A pointer installed at the front side of the spectrometer housing is used for alignment. Careful shielding of the camera housing, power supply, and data transfer cables mitigates interference by electromagnetic pulses (EMP) from the laser-produced plasma.
![]()
Figure 9.Mechanical construction of the monitor spectrometer. While the mechanical setup of the XRTS spectrometer is similar, it features a bent crystal to increase the signal strength on the detector, as shown in the inset.
The spectral range (SR) of the monitor spectrometer is limited by the CCD chip size. The length of 27.6 mm in the spectral direction realizes ΔESR > 300 eV for typical backlighters. A micrometer stage included in the spectrometer design allows for fine adjustment of the covered spectral range. Figure 10 shows a typical spectrum measured by the monitor spectrometer, obtained from a 10 μm-thick titanium foil, irradiated with 78.4 J of laser energy (at λ = 527 nm). The spectrum shows strong emission from the Heα resonance transition (1s2p1P1–1s21S0), the intercombination line (1s2p3P1,2–1s21S0), and dielectronic satellite lines from Li-like ions.
![]()
Figure 10.X-ray source spectra from a laser-produced titanium plasma, measured with the monitor (blue) and the XRTS spectrometer (orange). The He
We can use the narrow Heα resonance line to test the spectrometer resolution. Simulations with the FLYCHK atomic physics code53 indicate linewidths of 2–3 eV, assuming the density and temperature to lie in the reasonable ranges of n = (1–4) × 1021 cm−3 (from quarter-critical to critical density) and T = 1–2 keV. The experimentally determined spectral width of the Heα line of (7 ± 1) eV (FWHM) would therefore correspond to a broadening of approximately 6–7 eV. This is comparable to, although somewhat larger than, the expected value of
As we have measured both the integrated reflectivity of the crystal and the detector sensitivity (ADU/photon), we can determine the absolute X-ray yield. We have calculated the conversion efficiency from incident laser energy E2ω into line emission around the Heα photon energy Eph = 4.75 keV, taking into account the whole group of lines from 4.65 to 4.78 keV similarly to Ruggles et al.52 Assuming isotropic emission and taking into account the transmission through the backlighter target (τ ∼ 0.7), our value of E4.75 keV/E2ω ∼ 2 × 10⁻³ (for a shot with E2ω = 78.4 J on Ti) indicates an efficient X-ray production when compared with the E4.75 keV/E2ω ∼ 1 × 10⁻³ measured by Ruggles et al.52
B. X-ray Thomson scattering spectrometer
The XRTS spectrometer is based on the same type of HOPG crystal as used in the monitor spectrometer. However, here we have used a 50 mm-wide cylindrical crystal with a radius of curvature of 50 mm in von Hamos geometry,55 as shown in the inset of Fig. 9. This results in a significantly larger collection angle in the nondispersive direction. Also, the spectrum is spatially concentrated into a
An experimentally measured spectrum of the titanium X-ray source on the XRTS spectrometer (for a shot with E2ω = 78.4 J) is shown in Fig. 10. In the detected source spectrum, we determined a width of (9 ± 1) eV (FWHM) for the titanium Heα line. We confirmed the slightly broader linewidth, i.e., slightly poorer resolution, compared with the monitor spectrometer by ray tracing simulations with mmpxrt,54 which indicate a resolution of FWHM = 5.1 eV for the XRTS spectrometer compared with FWHM = 2.0 eV for the monitor spectrometer. Additionally, the source broadening is increased to 4.2 eV (for a 100 μm-diameter source) due to the smaller dispersion. Owing to the higher efficiency of the XRTS spectrometer, here an additional 110 μm of Al, compared with the monitor spectrometer, was used to attenuate the signal and avoid saturation when detecting the source spectrum.
Figure 10 also shows a scattering signal, obtained from a 60 μm-thick sample of ambient single-crystalline diamond, detected without any significant filtering (for a shot with E2ω = 92.6 J). The sample is located at a distance of 3 mm from the backlighter source, and a pinhole aperture is used to illuminate a circular area with a diameter of 1 mm on the sample. The different components are contained in an aluminum housing of a few centimeters size that confines the expanding plasma and provides ≥5 mm aluminum shielding from the laser-plasma interaction point toward the XRTS spectrometer. Here, the spectrometer is positioned at a scattering angle of 135° (with respect to the X-ray beam incident onto the sample). At this scattering angle, no Bragg reflections from the crystalline structure are located. Consequently, (nearly) no elastic scattering is observed in the scattering spectrum under ambient conditions. Scattering from weakly bound electrons leads to the broad inelastic scattering feature, red-shifted by the Compton shift.
Since the elastic scattering strength increases with temperature, XRTS can be used as temperature diagnostics for heavy-ion heated diamond samples.33 The elastic scattering signal is, however, broadened compared with the source spectrum, owing to the large size of the illuminated area on the diamond. The top plot in Fig. 10 shows our expectation of this signal. Here, we have projected the illuminated area of the diamond, which we have simplified to be a homogeneously illuminated circle, onto the detector of the XRTS spectrometer and convoluted it with the source spectrum obtained by the monitor spectrometer. Decreasing the pinhole size of the target assembly would reduce the broadening, but it would also reduce the strength of the scattering signal. For results regarding the application of XRTS as temperature diagnostics, we refer the reader to the paper by Lütgert et al.,33 who conducted an experiment on heavy-ion heated diamond following the commissioning of the diagnostics presented here.
The bottom plot in Fig. 10 shows the relative signal strengths of the same spectra as in the top plot. Despite the large illuminated area on the diamond, the inelastic scattering signal is around five orders of magnitude weaker than the source spectrum. Only a maximum of ∼250 photons are detected in each line of pixels in the nondispersive direction of the CCD detector. Therefore, the use of the focusing von Hamos geometry with a large curved crystal is clearly beneficial for the XRTS spectrometer. The increased signal strength for the XRTS spectrometer geometry compared with the monitor spectrometer amounts to nearly two orders of magnitude, as can be seen from the different signal strengths of the source spectra.
C. X-ray diffraction setup
While Lütgert et al.33 show results for X-rays diffracted off single-crystalline diamond samples at the HHT experimental station, here we demonstrate the capability of our XRD setup by diffraction from polycrystalline iron. The geometry of the setup is shown in Fig. 11. The PHELIX laser is incident onto a chromium backlighter foil (4 μm-thick chromium on a 125 μm-thick PET substrate), generating Heα emission at a photon energy of 5682 eV. (Note that here we have chosen chromium as backlighter material, since its Heα emission at a higher photon energy results in greater transmission through the iron sample compared with a titanium backlighter.) A piece of iron foil (10 μm thickness), glued onto a strip of polyethylene (50 μm thickness), and the backlighter foil are mounted on an aluminum housing, which fixes the geometry. An additional 100 μm-thick tantalum foil shields the direct line of sight from the detector onto the backlighter plasma.
![]()
Figure 11.Schematic top view of the iron target assembly and experimental setup, indicating the diffraction geometry. The transverse size of the iron sample determines the angular spread of the diffracted X-rays and therefore the width of the diffraction signals on the IP. The diffraction signal from (110) planes of ambient iron (BCC) is depicted in blue. The signals from (111) and (200) planes of the heated
Owing to the generally isotropic emission of X-rays from laser-produced plasmas, an aperture is usually required to limit the range of incidence angles of the probe radiation onto the sample. In the case of powder diffraction, this will determine the angular width of the diffraction rings. Here, instead of using an aperture, we have opted to limit the range of incidence angles by the transverse size of the sample. The expected angular spread of 4.9° for a sample with a transverse size of 0.5 mm is illustrated in Fig. 11. For detecting the diffracted X-rays, a single large imaging plate (IP; GE Healthcare BAS IP SR 2040 E) is placed at the back end of an aluminum housing [see Fig. 3(b)], which restricts the view of the IP onto the target assembly. The IP width of 10 cm covers an angular range of Δ(2θ) = 19° at a distance of ∼30 cm from the sample.
In the case of ambient iron (BCC), the well-known diffraction peak from (110) lattice planes is to be observed under an angle of 2θ = 65.1°, as shown by the blue lines in Fig. 11 (lattice constant a = b = c = 2.867 Å56 and a Heα photon energy of 5682 eV). If heated to the γ-phase (FCC), the diffraction peaks from (111) and (200) planes are expected to appear at 2θ = 62.4° (dashed red lines) and 2θ = 73.5° (solid red lines), respectively (assuming a = b = c = 3.648 Å as given by Seki and Nagata57 for the lowest temperature of the γ-phase, T = 1183 K). On the IP, the expected angular spread of 4.9° results in ∼25 mm-wide diffraction peaks. While this causes an overlap between the diffraction signal from (110) planes of the ambient α-phase and the signal from (111) planes of the heated γ-phase, we expect unambiguous identification of the γ-phase by the signal from (200) planes.
Figure 12 shows the measured diffraction signal from (110) planes of ambient iron. In addition to the 0.5 mm-wide iron samples, we tested a smaller width of 0.25 mm, which was expected to result in a smaller angular spread of 2.5° (the vertical dimension was kept constant at 0.5 mm). Additional broadening of the diffracted signal comes from the finite spectral width of the backlighter source and its spatial size. The convolutions of the above-mentioned contributions, assuming a Gaussian-shaped X-ray source with FWHM = 60 μm, are included in Fig. 12 and show excellent agreement with the measured signal.
![]()
Figure 12.Measured (meas.) and expected (expec.) diffraction signals from (110) planes of ambient iron (BCC). The width of the diffraction signal is governed by the two different transverse dimensions of the sample, 0.5 and 0.25 mm, which correspond to angular spreads of 4.9° and 2.5°, respectively. Furthermore, we have taken into account broadening due to the finite spectral width of the backlighter source and its spatial size. The inset shows the normalized source spectra of the chromium backlighter for the respective shots. In the case of the larger sample, the diffraction signal and the source signal are offset by 0.2 and 0.4, respectively, for better visibility.
The X-ray spectra detected with the monitor spectrometer for the two shots corresponding to the diffraction signals shown in Fig. 12 are included in the inset of the figure (E2ω = 75.2 J and E2ω = 97.6 J for the shots probing the 0.5 and 0.25 mm-wide iron samples, respectively). It is notable that the X-ray source is highly reproducible, which is beneficial for systematic studies. In conclusion, the diagnostic capabilities at the HHT experimental station are well suited for XRD studies of heavy-ion heated samples.
VI. MITIGATION STRATEGIES FOR HEAVY-ION BEAM-INDUCED BACKGROUND
A challenge inherent to the use of highly sensitive detectors for ionizing radiation, like the X-ray CCD arrays and imaging plates employed in our diagnostics, in a high-background-radiation environment is the significant noise level that can be induced by this background. In experiments utilizing intense pulses of high-energy heavy ions as described in this paper, energetic secondary particles are produced wherever the ions traverse material. In our setup, this includes the entrance window of the target chamber, the sample itself, and potentially the degrader.
We have assessed the expected background produced by the ion beam using the particle physics Monte Carlo simulation package FLUKA.58,59 A “pencil beam” of uranium ions at 350 MeV/u is propagated through the different components, and particles emitted from these components are registered to obtain energy and angular distributions. We find that this direct secondary radiation, mostly consisting of electrons, protons, and hard X-rays, completely dominates the energetic particle background. Tertiary radiation, i.e., radiation produced from secondary radiation impacting other surrounding material (e.g., the chamber walls) is negligible.
As an example, spectra from the interaction with the 50 μm-thick titanium entrance window (of diameter 10 cm) are shown in Fig. 13. Coulomb collisions of the projectile ions with electrons in the component generate “delta electrons” with energies up to 2mec2βpγp ≈ 900 keV, the maximum energy gained in a central collision, where βp and γp are the projectile velocity and relativistic parameter, respectively. Traversing the component material, these electrons generate hard X-rays by bremsstrahlung, as well as characteristic line emission following inner-shell ionization. A rather small number of gamma photons in the MeV regime most likely stems from excited nuclei. Nucleus-nucleus collisions result in the generation of protons with energies up to several hundred MeV, as well as heavier fragments.
![]()
Figure 13.FLUKA
Generally, the amount of background radiation grows proportionally to the amount of material traversed by the ion beam. For example, a carbon degrader with a thickness of 1 cm (and a diameter of 5 mm) emits ∼60 and ∼70 times more protons and photons, respectively, than the entrance window. For electrons, however, the amount and spectrum emitted can be strongly modified by energy loss and stopping of the electrons within the material. For example, the electron number increases by a factor of only ∼1.5, owing to reabsorption within the degrader.
We based our background mitigation strategies on the results of our FLUKA58,59 simulations. Regarding electrons, we reduced the background by placing magnets in front of the XRTS spectrometer and XRD detector. For example, electrons with 800 keV kinetic energy have a gyroradius of 20 mm in a magnetic field of B = 0.2 T, and therefore we used commercially available neodymium magnets paired with iron yokes for deflection. In contrast, the background from photons cannot easily be reduced, since the probe photon energies are much lower than the background photon energies, making the use of energy-selective elements necessary. While inherent to our X-ray spectrometers, we have forgone the use of such elements for our XRD detector, since they would come at the cost of small X-ray reflection efficiency.
Performing X-ray diagnostics while using a degrader necessitates further shielding against protons, since the range of, for example, 300 MeV protons in lead and iron is around 10 cm.60 Here, it is important to shield the lines of sight from detectors toward the degrader, since no typical camera housing provides sufficient proton stopping power. In our case, we shielded the detector of the XRTS spectrometer toward the sample and degrader using
The aforementioned measures taken against the background allow the reduction of the noise below the ambient signal level. We aim at further improving the signal-to-noise ratio for future experiments to be even more sensitive to small changes in the signal. For this, it seems promising to consider the angular dependence of the emission of secondary particles, which is most characteristic of the protons. As shown in Fig. 14, they are mostly emitted at small angles with respect to the ion-beam direction, i.e., mostly in the “downstream” direction. Therefore, placing detectors upstream of the components emitting background radiation, in particular the degrader, seems beneficial, even though this area of the target chamber offers less space and has worse accessibility. While the detectors are located closer to the entrance window if moved in the upstream direction, and therefore sufficient shielding must be ensured, the shielding requirements toward the sample and degrader will be more relaxed. This promises to improve the signal-to-noise ratio, especially for diagnostics like the XRD detector that require a direct line of sight onto the sample, and, as a geometrical consequence, can typically not be shielded toward the degrader, which has to be placed close by. Further improvements might be made by modifying the experimental setup so that operation without an entrance window is possible.
![]()
Figure 14.FLUKA
VII. CONCLUSION AND OUTLOOK
The addition of a high-energy laser beamline from the PHELIX laser facility to GSI’s HHT cave offers a unique combination of intense heavy-ion pulses from the SIS18 synchrotron with energetic laser pulses. A new target chamber with sufficient space for large-aperture laser beams and an array of in-vacuum diagnostic setups enables such combined ion/laser beam experiments.
In the commissioning experiments reported in this paper, we have used PHELIX to generate laser-produced plasmas emitting intense Heα line radiation. Applying this emission as an X-ray backlighter source, we have demonstrated X-ray diffraction and spectrally resolved X-ray Thomson scattering. Our experimental setup was designed for future pump-probe experiments employing heavy-ion beam heating. Consequently, we have devised significant shielding and background suppression measures that will allow measurements despite the high-background environment. Further background mitigation strategies, such as placing detectors upstream of the sample, will be pursued in the future.
We have pyrometrically measured temperatures to which samples of different materials were heated by the heavy-ion beam and have obtained a decent agreement with our calculations using the measured ion-beam parameters. With the currently rather low ion numbers, limited to ∼4 × 10⁹, maximum temperatures of ≳ 4000 K are reached in tantalum samples. To reduce the uncertainty in the beamline transmission, we aim for measurements of the ion number directly in front of the target chamber. In the future experiments, our X-ray diagnostics suite will be extended to, among others, absorption spectroscopy applied to the aluminum K-edge. For that, spectrally broad X-ray emission from a laser-driven plasma will be generated by a suitable choice of backlighter material.
The SIS18 synchrotron is currently being upgraded in preparation to serve as the injector into FAIR’s main accelerator, the SIS100 heavy-ion synchrotron. To this end, SIS18 reaches record-high ion numbers and has recently delivered up to 3 × 10¹⁰ ions to the HHT cave.61 This mode, however, requires ions in a low charge state (e.g., U28+), which cannot be tightly focused by the existing normal-conducting focusing magnets at HHT. Nevertheless, this kind of enlarged ion focus can be applied for a different experimental scheme62 based on heating of a cylindrical high-Z shell that results in the implosion of the sample material inside, reaching conditions similar to planetary interiors.
While serving for further experiments at HHT, eventually the presented platform is foreseen for the APPA cave at FAIR, where the full configuration stage will deliver pulses of up to 5 × 10¹¹ heavy ions, which can be tightly focused thanks to the use of superconducting magnets. This will allow to directly heat samples volumetrically to the strongly coupled WDM regime.
SUPPLEMENTARY MATERIAL
ACKNOWLEDGMENTS
Acknowledgment. The results presented here are based on the experiment S489, which was performed at the target station HHT at the GSI Helmholtzzentrum für Schwerionenforschung GmbH, Darmstadt (Germany), in the framework of FAIR Phase-0. J.L. and D.K. were supported by GSI Helmholtzzentrum für Schwerionenforschung GmbH, Darmstadt, as part of the R&D Project No. SI-URDK2224 with the University of Rostock. R.B. acknowledges support by the Federal Ministry of Education and Research (BMBF) under Grant No. 05P21RFFA2. O.H. and D.K. were supported by the Helmholtz Association under Grant No. ERC-RA-0041. The HHT target chamber and vacuum pumping system have been financed via the BMBF ErUM-APPA collaborative research scheme (contract numbers 05P19RFFA1 – Goethe-Universität Frankfurt, 05P19SJFA1 and 05P21SJFA2 – Friedrich-Schiller-Universität Jena).
APPENDIX: EMISSIVITIES
References
[19] R.Balss, A.Bleile, L.Bozyk, J. V.Ceballos, P. J.Spiller. Status of the fair synchrotron projects SIS18 AND SIS100, 1857-1860(2014).
[23] P.Spiller, S.Udrea, D.Varentsov. Influence of focal length and beam rigidity on final focusing at HHT(2004).
[28] A.Kramida, Y.Ralchenko, J.Reader(2023).
[58] A.Fasso, A.Ferrari, J.Ranft, P. R.Sala. FLUKA: A multi-particle transport code(2005).
[63] V. Y.Chekhovskoy, L. N.Latiyev, V. A.Petrov, A.Sheindlin, E. N.Shestakov. Radiative Properties of Solid Materials, Reference Book(1974).


Set citation alerts for the article
Please enter your email address

© Copyright 2018-2021 | Chinese Laser Press. All Rights Reserved 沪ICP备15018463号-20