
Jianbo LI, Zhen TIAN, Quanwei JIANG, Lifeng YU, Huijun KANG, Zhiqiang CAO, Tongmin WANG. Effects of Different Element Doping on Microstructure and Thermoelectric Properties of CaTiO3 [J]. Journal of Inorganic Materials, 2023, 38(12): 1396
- Journal of Inorganic Materials
- Vol. 38, Issue 12, 1396 (2023)
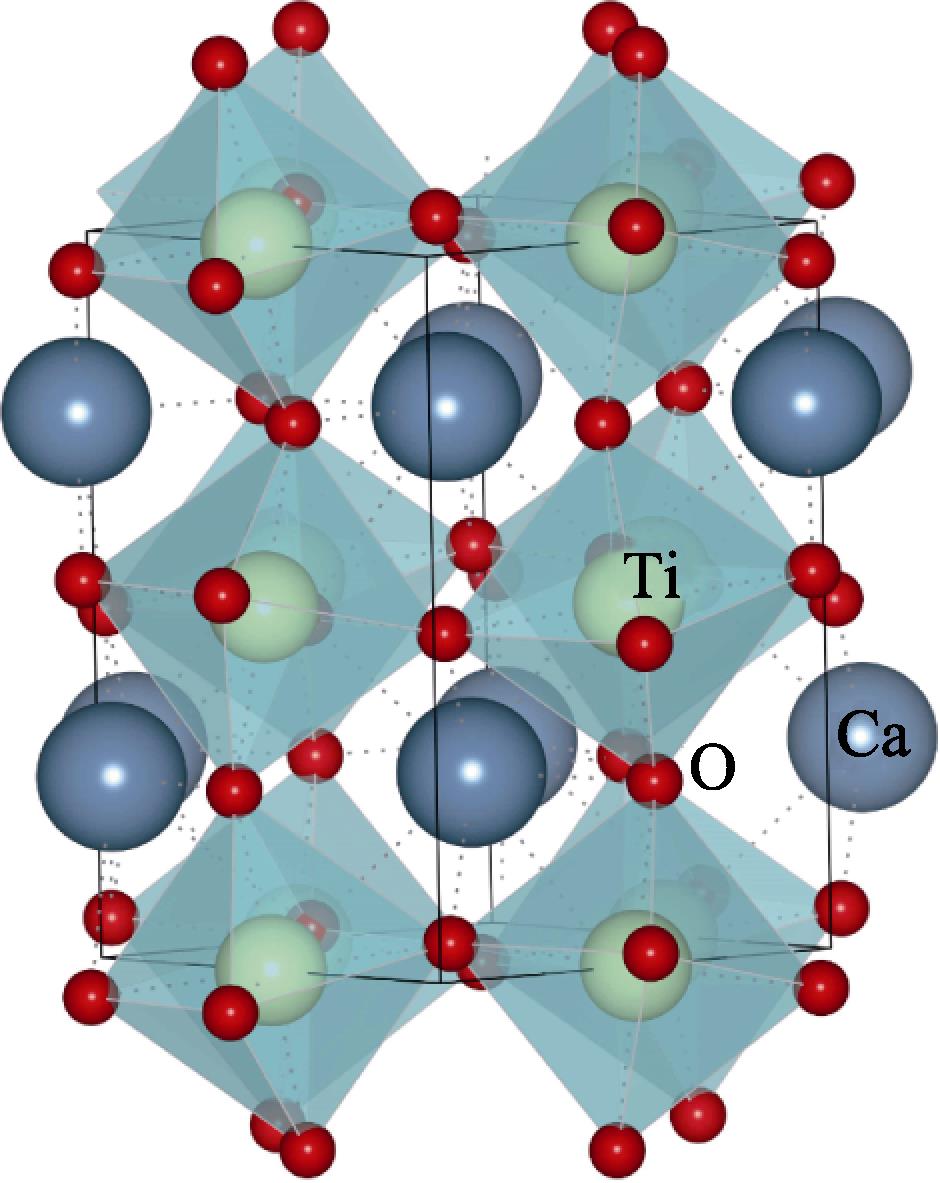
1. Schematic diagram of crystal structure for CaTiO3 at room temperature
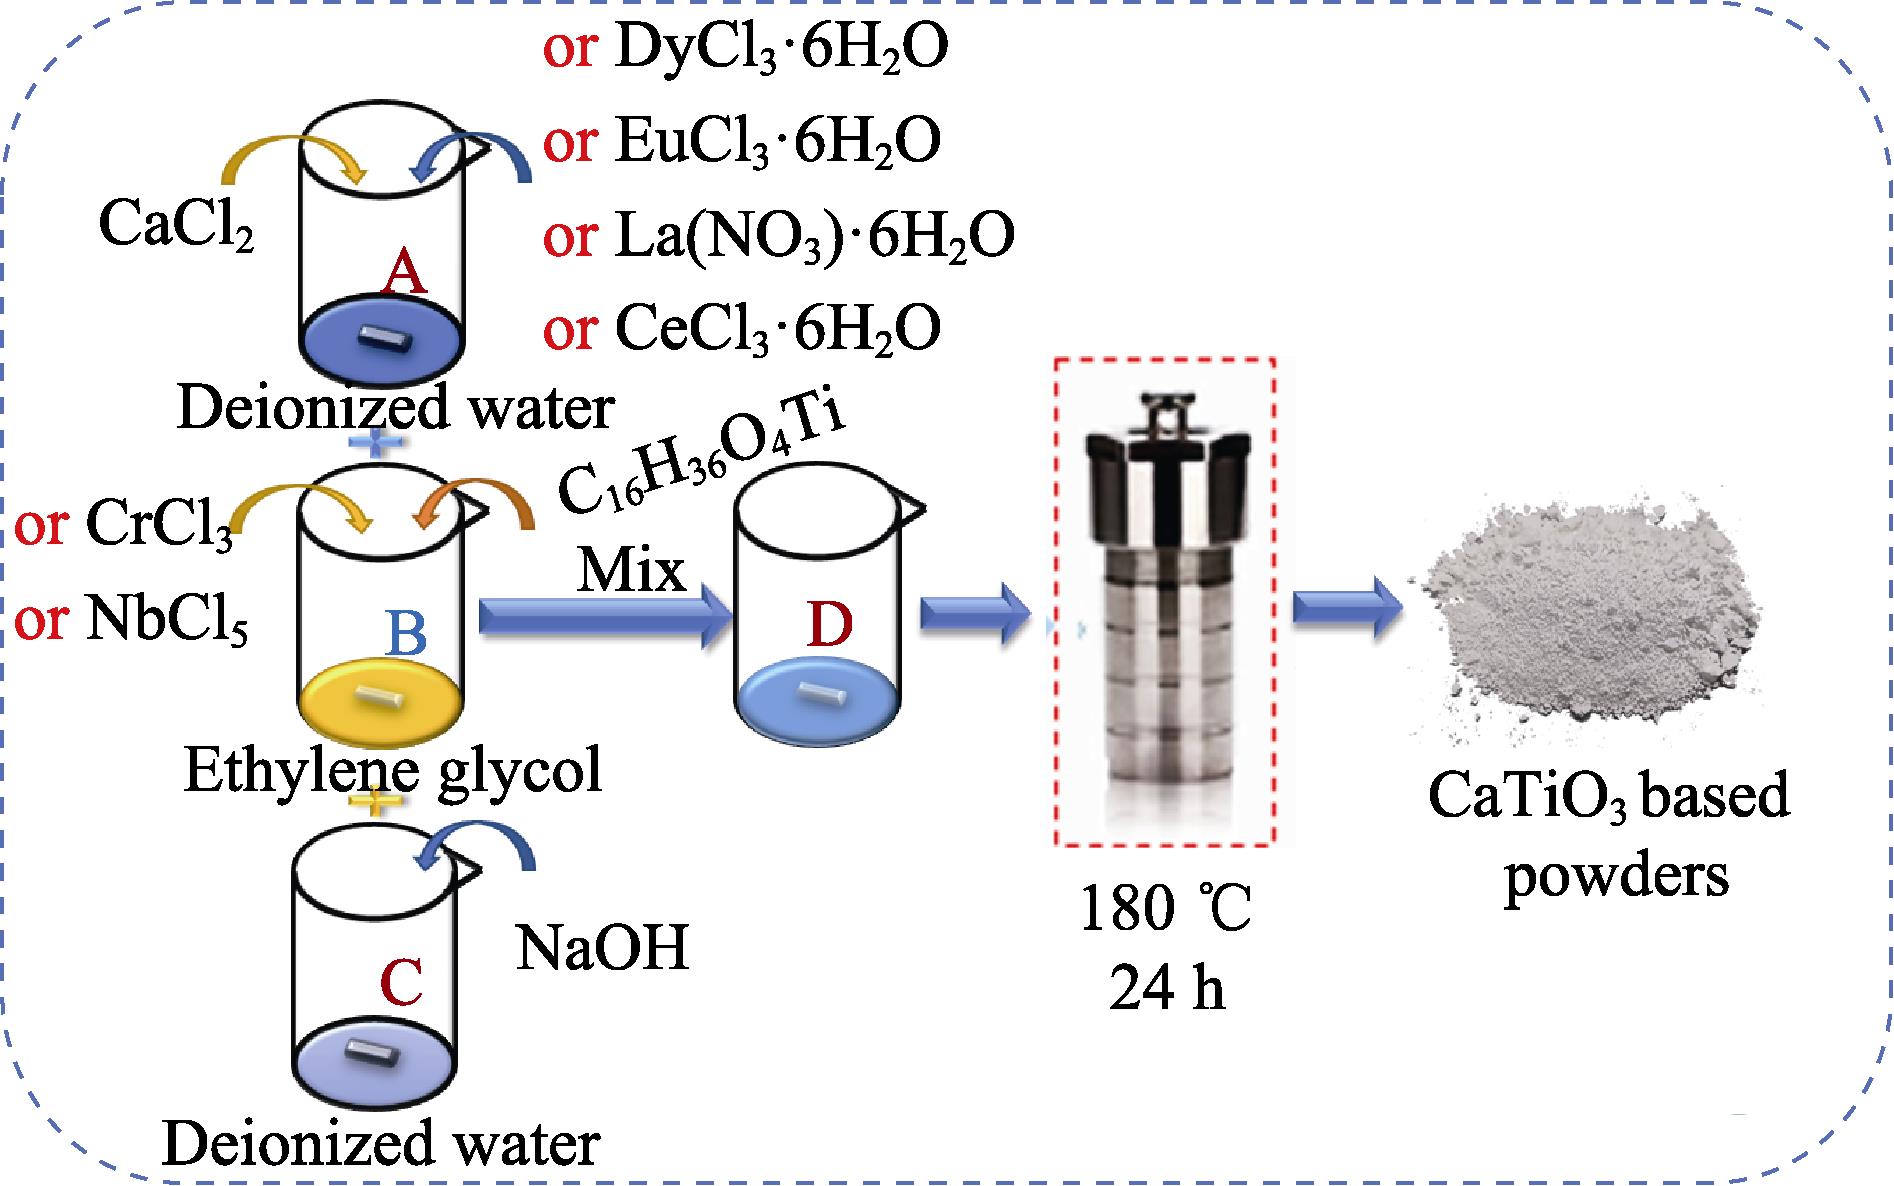
2. Schematic diagram of synthesis of CaTiO3 by hydrothermal method
3. XRD patterns of CaTiO3 (a, b) powders and (c, d) bulks doped with different elements; (e) SEM image of powder and (f) BES image of bulk for the pristine CaTiO3 sample
4. SEM images, element mappings, and corresponding EDS spectra of (a) Cr20, (b) Nb20, (c) Eu20, (d) Dy20, (e) Ce20, and (f) La20 powders
5. EPMA images, element mappings, and corresponding chemical compositions of (a) Cr20, (b) Nb20, (c) Eu20, (d) Dy20, (e) Ce20, and (f) La20 bulks
6. Temperature-dependence of (a) electrical conductivity, (b) Seebeck coefficient with inset showing enlarged plots in temperature range of 300-600 K, (d) power factor, (f) total thermal conductivity, (g) lattice thermal conductivity, and (h) ZT of Cr20, Nb20, Eu20, Dy20, Ce20, and La20 bulks, and their (c) carrier concentration at 320 K, (e) Pisarenko curves and (i) ZT compared to literature[18⇓⇓-21]
S1. XRD pattern of the CaTi0.8Cr0.2O3 bulk
S2. Temperature-dependent (a) thermal diffusion, (b) specific heat, (c) electrical thermal conductivity, and (d) Lorenz constant for pristine for Pristine CaTiO3, Cr20, Nb20, Eu20, Dy20, Ce20, and La20 samples
S3. EPMA backscattering images of the CaTi0.8Nb0.2O3 (Nb20) bulk sintered at (a) 1400, (b) 1450, and (c) 1500 ℃, respectively
S4. Temperature-dependence of the (a) electrical conductivity, (b) Seebeck coefficient, and (c) power factor of CaTi0.8Nb0.2O3 (Nb20) sintered at (a) 1400, (b) 1450, and (c) 1500 ℃, respectively
|
Table 1. Atomic radii and ionic radii of different atoms
|
Table 1. Summary of the raw materials used for experiments
|
Table 2. Nominal chemical compositions, sample codes, measured densities, theoretical densities, and relative densities of the prepared bulk samples


Set citation alerts for the article
Please enter your email address

© Copyright 2018-2021 | Chinese Laser Press. All Rights Reserved 沪ICP备15018463号-20