
Botao Fu, Renhong Gao, Ni Yao, Haisu Zhang, Chuntao Li, Jintian Lin, Min Wang, Lingling Qiao, Ya Cheng. Soliton microcomb generation by cavity polygon modes[J]. Opto-Electronic Advances, 2024, 7(8): 240061-1
- Opto-Electronic Advances
- Vol. 7, Issue 8, 240061-1 (2024)
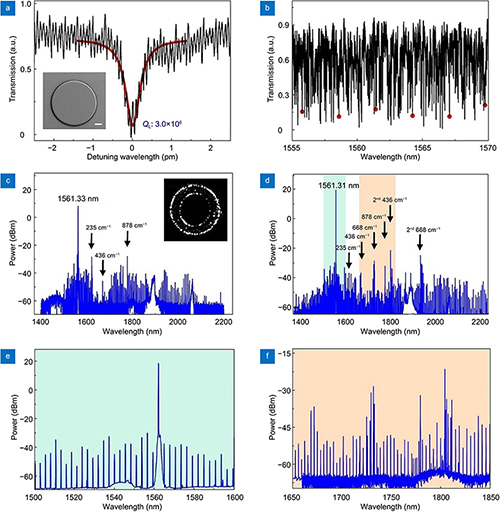
Fig. 1. Raman comb generation. (a ) The loaded Q factor of the fundamental WGM around 1561.32 nm wavelength. Inset: the scanning electron microscope (SEM) image of the fabricated microdisk, and the scale bar is 20 μm. (b ) The transmission spectrum of the WGMs, where the fundamental mode family is labeled with red dots. (c ) The spectrum of Raman comb when pumped at 1561.33 nm. Inset: The optical micrograph of the fundamental WGMs. (d ) The spectrum of Raman comb when pumped at 1561.31 nm. (e ) and (f ) The enlarged spectral region labelled with the colored boxes in Fig. 1(d) .
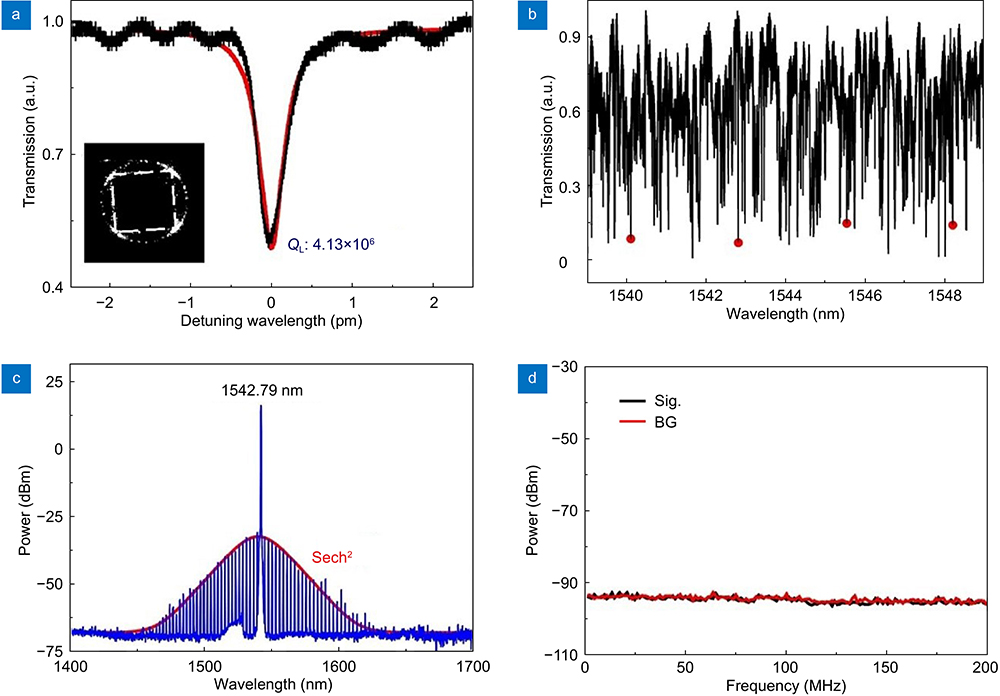
Fig. 2. Soliton comb generation from polygon modes. (a ) The measured loaded-Q factor of the mode around 1542.80 nm. Inset: the optical micrograph of the polygon modes. (b ) The transmission spectrum of the square mode family (labelled with red dots). (c ) The spectrum of the comb lines when pumping at 1542.79 nm. (d ) The RF spectrum of soliton comb, where signal and background are denoted as Sig. and BG.
Fig. 3. Dispersion design. (a ) Simulated group refractive index curves. Here, the fundamental WGM TE0 is denoted as TE0 mode. (b ) Simulated group velocity dispersion curves. (c ) Simulated and its corresponding experimental integrated dispersion curves of the square modes, corresponding to the second-order dispersion D2/(2π) of 0.8 MHz. (d ) The effective cavity nonlinear volumes of WGMs and square mode as a function of cosΘλ,R. Inset: the calculated mode profile of the polygon mode.
Fig. 4. Comparison of geometrical features between the fundamental WGM and the square mode. (a ) The WGM orbit cosΘ (Cosine) as a function of eigenvalue. (b ) The mode distribution characteristics of fundamental WGM. (c ) Close-up images of the WGM orbits for the relative mode numbers of −50, 0, and 50. (d ) The classical orbit as a function of eigenvalue. (e ) The mode distribution characteristics of the square mode. (f ) Close-up images of the square orbits for the relative mode numbers of −50, 0, and 50.
Fig. 5. Evolution of the Kerr comb generation. (a -c ) The spectra of the comb lines when tuning the pump wavelength from 1542.83 nm to 1542.81 nm. Inset in Fig. 5(c) : the RF spectrum of chaotic comb. (d ) The transmission spectrum during wavelength scanning, exhibiting a soliton step.


Set citation alerts for the article
Please enter your email address

© Copyright 2018-2021 | Chinese Laser Press. All Rights Reserved 沪ICP备15018463号-20