• Photonics Research
  • Vol. 13, Issue 4, 968 (2025)
Shuangli Li1, Lujun Huang1,2,3,*, Haozong Zhong1, Minghao Ning1..., Ling-En Zhang1, Yaling Yin1,4,*, Ya Cheng1,2 and Lin Li1,2,5,*|Show fewer author(s)
Author Affiliations
  • 1State Key Laboratory of Precision Spectroscopy, School of Physics and Electronic Science, East China Normal University, Shanghai 200241, China
  • 2Collaborative Innovation Center of Extreme Optics, Shanxi University, Taiyuan 030006, China
  • 3e-mail: ljhuang@phy.ecnu.edu.cn
  • 4e-mail: ylyin@phy.ecnu.edu.cn
  • 5e-mail: lli@lps.ecnu.edu.cn
  • show less
    DOI: 10.1364/PRJ.547681 Cite this Article Set citation alerts
    Shuangli Li, Lujun Huang, Haozong Zhong, Minghao Ning, Ling-En Zhang, Yaling Yin, Ya Cheng, Lin Li, "Observation of multiple quasi-bound states in the continuum by symmetry breaking in a photonic crystal slab," Photonics Res. 13, 968 (2025) Copy Citation Text show less
    (a) Scheme of a triangular-lattice PCS. (b) Schematic illustration of first Brillouin zone of the PCSs. (c) Calculated band structure of PCSs. BIC-1, BIC-2, BIC-3, and BIC-4 at the Γ point are indicated by the red, pink, blue, and light blue lines, respectively. (d) Cross section of the PCSs. The radius of the circle hole is b. The semi-long axis and semi-short axis radii of the ellipse are a and b, respectively. (e)–(h) Eigen field profiles of BIC-1, BIC-2, BIC-3, and BIC-4. (i)–(l) Q-factors of BIC-1, BIC-2, BIC-3, and BIC-4 in the Γ-K direction.
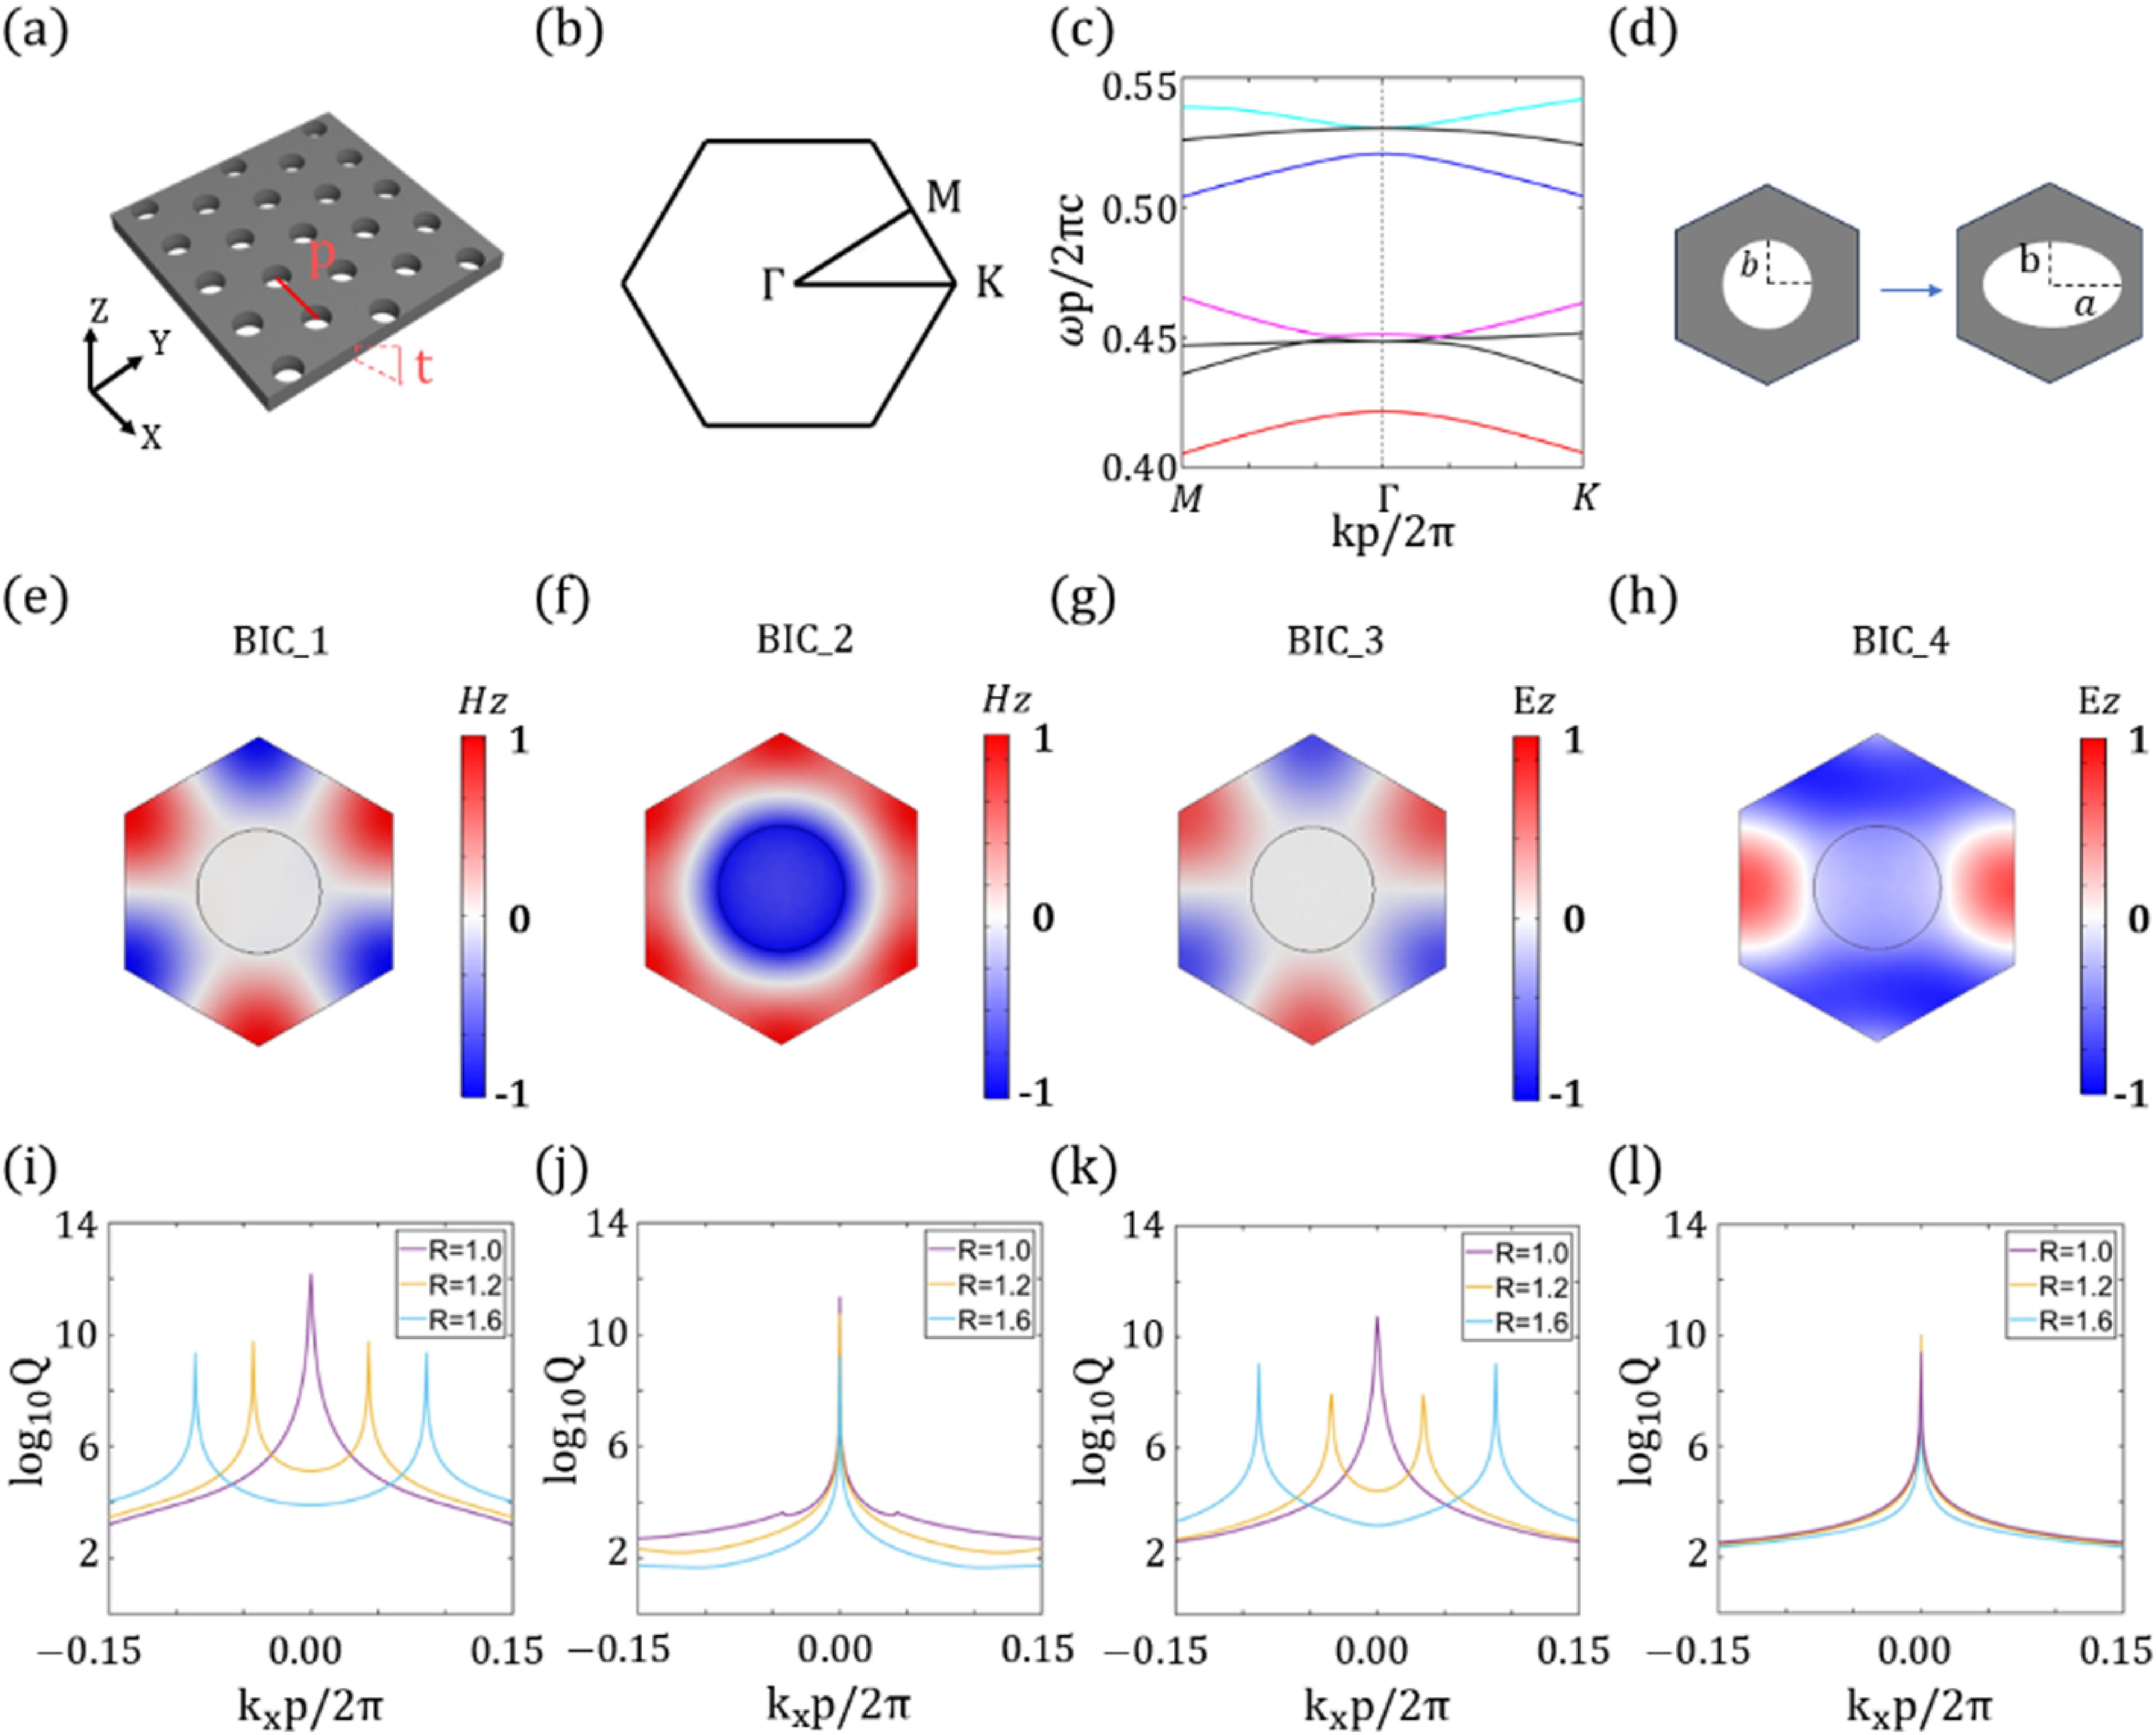
    Fig. 1. (a) Scheme of a triangular-lattice PCS. (b) Schematic illustration of first Brillouin zone of the PCSs. (c) Calculated band structure of PCSs. BIC-1, BIC-2, BIC-3, and BIC-4 at the Γ point are indicated by the red, pink, blue, and light blue lines, respectively. (d) Cross section of the PCSs. The radius of the circle hole is b. The semi-long axis and semi-short axis radii of the ellipse are a and b, respectively. (e)–(h) Eigen field profiles of BIC-1, BIC-2, BIC-3, and BIC-4. (i)–(l) Q-factors of BIC-1, BIC-2, BIC-3, and BIC-4 in the Γ-K direction.
    Simulated polarization vectors around the BICs with the log10Q as the background color. (a)–(d) Correspond respectively to BIC-1, 2, 3, and 4. Left: for triangular-lattice PCSs with circular holes. Right: for triangular-lattice PCSs with elliptical holes (R=1.2).
    Fig. 2. Simulated polarization vectors around the BICs with the log10Q as the background color. (a)–(d) Correspond respectively to BIC-1, 2, 3, and 4. Left: for triangular-lattice PCSs with circular holes. Right: for triangular-lattice PCSs with elliptical holes (R=1.2).
    (a)–(c) Schematics of triangular-lattice PCSs slab with circular holes (θ=0°,45°,90°). (d)–(f) Q-factors versus α=a−bb at Γ point in the mode 1 (θ=0°,45°,90°). (g)–(i) Q-factors versus α=a−bb at Γ point in the mode 3 (θ=0°,45°,90°).
    Fig. 3. (a)–(c) Schematics of triangular-lattice PCSs slab with circular holes (θ=0°,45°,90°). (d)–(f) Q-factors versus α=abb at Γ point in the mode 1 (θ=0°,45°,90°). (g)–(i) Q-factors versus α=abb at Γ point in the mode 3 (θ=0°,45°,90°).
    (a)–(c) Q-factors versus α=a−bb at Γ point in the mode 2 (θ=0°,45°,90°). (d)–(f) Q-factors versus α=a−bb at Γ point in the mode 4 (θ=0°,45°,90°).
    Fig. 4. (a)–(c) Q-factors versus α=abb at Γ point in the mode 2 (θ=0°,45°,90°). (d)–(f) Q-factors versus α=abb at Γ point in the mode 4 (θ=0°,45°,90°).
    Schematic illustration of experimental setup based on cross-polarization measurement.
    Fig. 5. Schematic illustration of experimental setup based on cross-polarization measurement.
    (a) Schematic illustration of a photonic crystal slab under plane wave illumination. (b) SEM image of a PCS. The scale is 400 nm. (c) Scattering spectra of PCSs with Δ=a−b=20 nm. (d) Scattering spectra of PCSs while a quasi-BIC based on BIC-1 is excited in this wavelength window. (e), (f) Retrieved resonance wavelengths (e) and Q-factors (f) of resonance based on mode 1 at different Δ=a−b. (g) Scattering spectra of PCS while a quasi-BIC based on BIC-3 is excited in this wavelength window. (h), (i) Retrieved resonance wavelengths (h) and Q-factors (i) of resonance based on mode 3 at different Δ=a−b.
    Fig. 6. (a) Schematic illustration of a photonic crystal slab under plane wave illumination. (b) SEM image of a PCS. The scale is 400 nm. (c) Scattering spectra of PCSs with Δ=ab=20  nm. (d) Scattering spectra of PCSs while a quasi-BIC based on BIC-1 is excited in this wavelength window. (e), (f) Retrieved resonance wavelengths (e) and Q-factors (f) of resonance based on mode 1 at different Δ=ab. (g) Scattering spectra of PCS while a quasi-BIC based on BIC-3 is excited in this wavelength window. (h), (i) Retrieved resonance wavelengths (h) and Q-factors (i) of resonance based on mode 3 at different Δ=ab.
    (a) Scattering spectra of PCSs while a quasi-BIC based on BIC-2 is excited in this wavelength window. (b) Scattering spectra of PCSs while a quasi-BIC based on BIC-4 is excited in this wavelength window. (c), (d) Retrieved resonance wavelengths (c) and Q-factors (d) of resonance based on mode 2 and mode 4 at different Δ=a−b. In the legends of (c) and (d), 0.01 and 0.02 represent (kx,ky)=(0.012πp,0.012πp) and (kx,ky)=(0.022πp,0.022πp), which correspond to angles of approximately 1° and 3°, respectively.
    Fig. 7. (a) Scattering spectra of PCSs while a quasi-BIC based on BIC-2 is excited in this wavelength window. (b) Scattering spectra of PCSs while a quasi-BIC based on BIC-4 is excited in this wavelength window. (c), (d) Retrieved resonance wavelengths (c) and Q-factors (d) of resonance based on mode 2 and mode 4 at different Δ=ab. In the legends of (c) and (d), 0.01 and 0.02 represent (kx,ky)=(0.012πp,0.012πp) and (kx,ky)=(0.022πp,0.022πp), which correspond to angles of approximately 1° and 3°, respectively.
    Shuangli Li, Lujun Huang, Haozong Zhong, Minghao Ning, Ling-En Zhang, Yaling Yin, Ya Cheng, Lin Li, "Observation of multiple quasi-bound states in the continuum by symmetry breaking in a photonic crystal slab," Photonics Res. 13, 968 (2025)
    Download Citation