
Qingying FENG, Dong LIU, Ying ZHANG, Hao FENG, Qiang LI. Thermodynamic and First-principles Assessments of Materials for Solar-driven CO2 Splitting Using Two-step Thermochemical Cycles [J]. Journal of Inorganic Materials, 2022, 37(2): 223
- Journal of Inorganic Materials
- Vol. 37, Issue 2, 223 (2022)
![Thermodynamic assessment mapThe combination of ΔSsolid and ΔHsolid of redox material candidates should fall in the shaded triangular region. The experimental data points (open scatters) of (ΔSsolid, ΔHsolid) were plotted for pure CeO2/CeO2-δ and 10% Samaria-doped Ce0.9Sm0.1O1.95/Ce0.9Sm0.1O1.95-δ redox pairs (δ=0.01-0.05)[28,29]. The calculation results (solid scatters) in Section 2 were also plotted for these redox pairs (δ=0.03). Error bars represent standard deviations. Colourful figure is available on website](/richHtml/jim/2022/37/2/223/img_1.png)
1. Thermodynamic assessment mapThe combination of ΔS solid and ΔH solid of redox material candidates should fall in the shaded triangular region. The experimental data points (open scatters) of (ΔS solid, ΔH solid) were plotted for pure CeO2/CeO2-δ and 10% Samaria-doped Ce0.9Sm0.1O1.95/Ce0.9Sm0.1O1.95-δ redox pairs (δ =0.01-0.05)[28,29]. The calculation results (solid scatters) in Section 2 were also plotted for these redox pairs (δ =0.03). Error bars represent standard deviations. Colourful figure is available on website
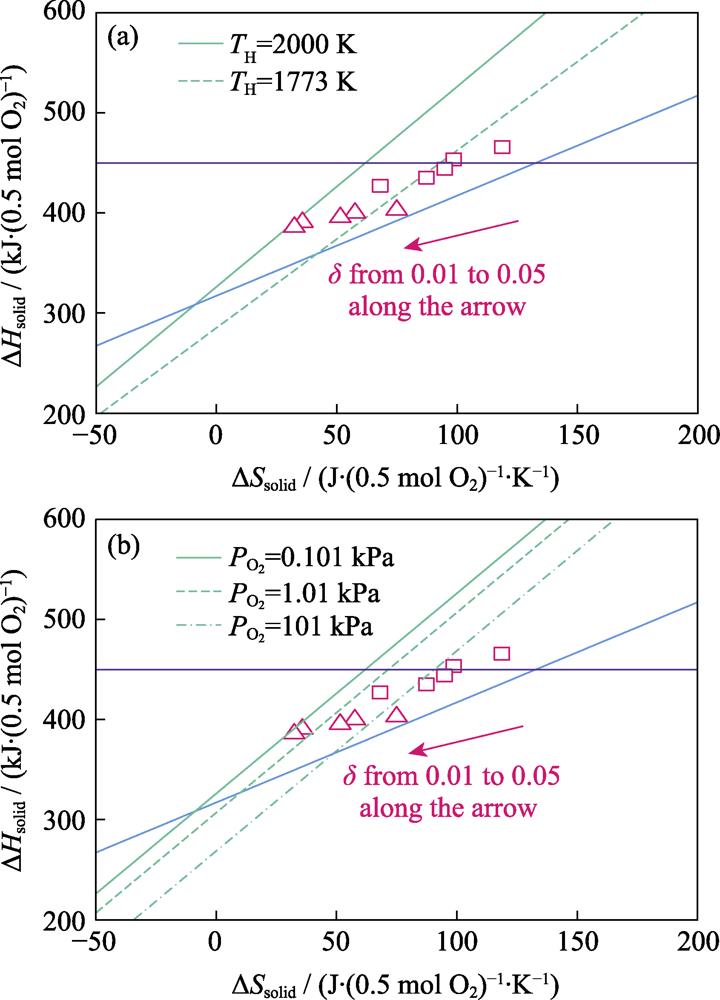
2. Variations of the favorable regions with operating conditions of the thermal reduction step (Reaction (2)) (a) Temperature. T H=2000 and 1773 K; (b) Pressure. P O2=0.101, 1.01 and 101 kPa. Other conditions in (a, b) are the same with those in Fig. 1 ; Colourful figure is available on website
3. Supercells for DFT+U calculations
(a) Bulk CeO2 supercell; (b) CeO2 supercell with a single oxygen- vacancy defect; (c) CeO2 supercell with a single polaron defect(The charge density of the polaron is also shown); (d) Sm-doped CeO2 supercell (Methods in Supporting Materials)
4. Variations of $\Delta {{S}_{\text{V}_{\text{O}}^{\centerdot \centerdot }}}$, $2\Delta {{S}_{\text{C}{{{\text{{e}'}}}_{\text{Ce}}}}}$, ΔS vib, and ΔS solid with temperature
Solid and dash curves are for CeO2/CeO2-δ and Ce0.9Sm0.1O1.95/Ce0.9Sm0.1O1.95-δ redox pairs (δ =0.03), respectively; Colourful figure is available on website
5. Illustration of a viable screening approach
S1. Phonon dispersion of a 10% samaria-doped ceria supercell comprising an oxygen vacancy
S2. Calculated variations of (a) α V, (b) K T and (c) α V×K T with temperatures
|
Table 1.
Relaxation volumes due to formations of an oxygen vacancy and a polaron for CeO2-
|
Table 1.
Comparison between calculated and measured values of Δ


Set citation alerts for the article
Please enter your email address

© Copyright 2018-2021 | Chinese Laser Press. All Rights Reserved 沪ICP备15018463号-20