• Infrared and Laser Engineering
  • Vol. 53, Issue 1, 20230364 (2024)
Qinghua Liang, Yanfeng Wei, Honglei Chen, Jing Guo, and Ruijun Ding*
Author Affiliations
  • National Key Laboratory of Infrared Detection Technologies, Shanghai Institute of Technical Physics, Chinese Academy of Sciences, Shanghai 200083, China
  • show less
    DOI: 10.3788/IRLA20230364 Cite this Article
    Qinghua Liang, Yanfeng Wei, Honglei Chen, Jing Guo, Ruijun Ding. Research of IRFPA ROIC for astronomy[J]. Infrared and Laser Engineering, 2024, 53(1): 20230364 Copy Citation Text show less
    Structure of SFD circuit
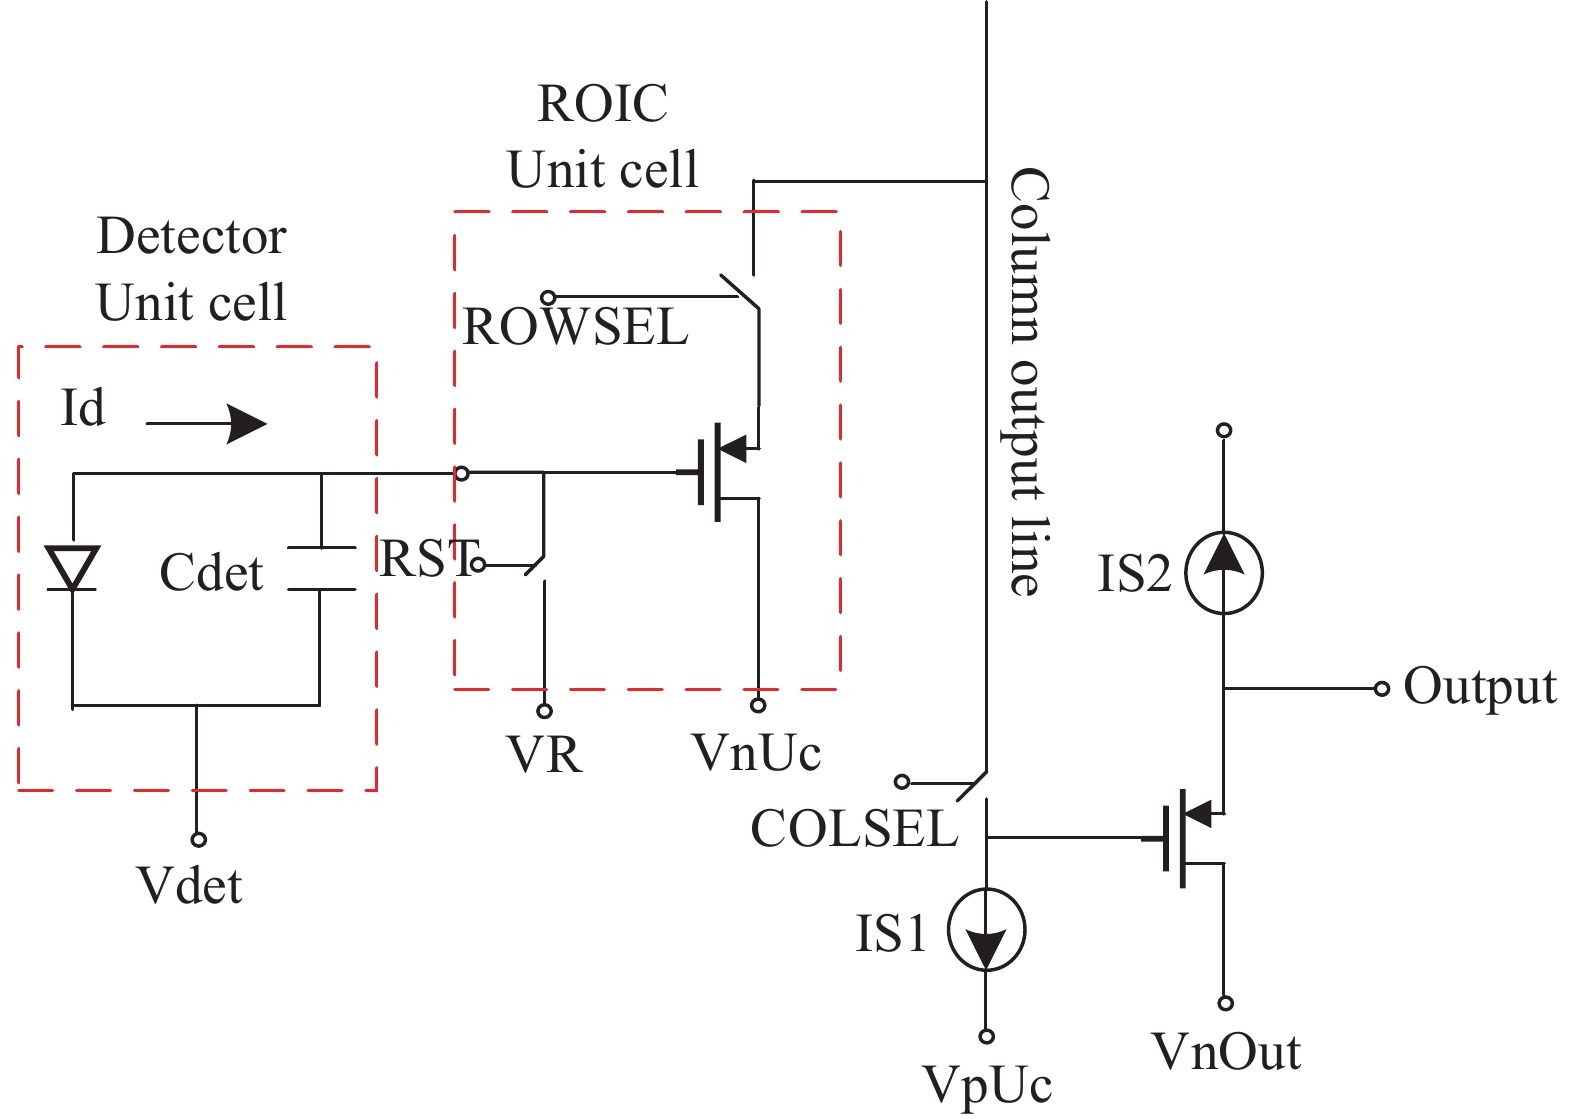
    Fig. 1. Structure of SFD circuit
    Circuit block diagram
    Fig. 2. Circuit block diagram
    Structure of analog circuit
    Fig. 3. Structure of analog circuit
    Structure of OTA
    Fig. 4. Structure of OTA
    Analog signal chain and current bias diagram
    Fig. 5. Analog signal chain and current bias diagram
    Structure of current bias
    Fig. 6. Structure of current bias
    Layout of corecell circuit
    Fig. 7. Layout of corecell circuit
    Controlling time series of simulation(NDR=0)
    Fig. 8. Controlling time series of simulation(NDR=0)
    Controlling time series of simulation(NDR=1)
    Fig. 9. Controlling time series of simulation(NDR=1)
    Structure of SR latch
    Fig. 10. Structure of SR latch
    Structure of NDR circuit 1
    Fig. 11. Structure of NDR circuit 1
    Simulation result of NET1
    Fig. 12. Simulation result of NET1
    Structure of NDR circuit 2
    Fig. 13. Structure of NDR circuit 2
    Simulation result of NET3
    Fig. 14. Simulation result of NET3
    Simulation result of INTRST(NDR=0)
    Fig. 15. Simulation result of INTRST(NDR=0)
    Simulation result of INTRST(NDR=1)
    Fig. 16. Simulation result of INTRST(NDR=1)
    Diagram of non-destructive readout function
    Fig. 17. Diagram of non-destructive readout function
    Relationship diagram between signal and time
    Fig. 18. Relationship diagram between signal and time
    Relationship between output voltage and photocurrent
    Fig. 19. Relationship between output voltage and photocurrent
    Sample picture of IRFPA
    Fig. 20. Sample picture of IRFPA
    Test system of long integration time
    Fig. 21. Test system of long integration time
    Average voltage of FPA vs integration time
    Fig. 22. Average voltage of FPA vs integration time
    Dark current of 640×512 IRFPA
    Fig. 23. Dark current of 640×512 IRFPA
    Test results of dark current
    Fig. 24. Test results of dark current
    Dark current under different power consumption
    Fig. 25. Dark current under different power consumption
    Dark current under different power consumption
    Fig. 26. Dark current under different power consumption
    Signal voltage vs integration time
    Fig. 27. Signal voltage vs integration time
    Test result of circuit noise (5 fF)
    Fig. 28. Test result of circuit noise (5 fF)
    ProductHawii−2RGVIRGOALFA
    CompanyTeledyneRaytheonSofradir
    Resolution2 k×2 k2 k×2 k2 k×2 k
    Pixel pitch18 μm20 μm15 μm
    Detection band0.6-2.5 μm0.85-2.5 μm0.8-2.5 μm
    Temperature77 K78 K100 K
    Dark current$ \leqslant $0.05 e-·s−1$ \leqslant $1 e-·s−1$ \leqslant $0.1 e-·s−1
    Readout noise$ \leqslant $18 e-rms$ \leqslant $20 e-rms$ \leqslant $18 e-rms
    Charge capacity$ \geqslant $80 ke->200 ke-$ \geqslant $60 ke-
    Power consumption$ \leqslant $1 mW(100 kHz)$ \leqslant $7 mW(280 kHz)$ \leqslant $2.8 mW(100 kHz)
    Nonlinearity-$ < \pm $0.3%$ \leqslant $3%
    Table 1. Performance of IRFPA for international astronomical application
    TEST1TEST2TEST3
    VADJ3.33.32.1
    IM(1-0)000001
    UP(2-0)000010010
    AP(1-0)000001
    DP(1-0)000000
    Total working current3.9 mA7.7 mA10.9 mA
    Power consumption14.04 mW27.2 mW39.24 mW
    Dark current0.9 e-·s−12.2 e-·s−12.8 e-·s−1
    Table 2. Dark current under different power consumption
    SpecificationPerformance
    Array Size640×512
    Pixel pitch15 μm
    Cut−off wavelength1.7 μm
    Charge capacity35.9 ke-
    Noise27 e-
    Responsivity mean2.58×$ {10}^{7} $ V/W
    Peak detectivity mean2.62×$ {10}^{13} $ cm·Hz1/2/W
    Uniformity1.58%
    Table 3. Performance parameters of FPA
    Qinghua Liang, Yanfeng Wei, Honglei Chen, Jing Guo, Ruijun Ding. Research of IRFPA ROIC for astronomy[J]. Infrared and Laser Engineering, 2024, 53(1): 20230364
    Download Citation