
Xiaohong QI, Xiaokang LIANG, Zheng XIAO, Zhengyu WEI, Xinwei LIU, Zhuangzhuang LIU. Mechanical behavior of lattice-reinforced porous structures of Inconel 718 fabricated by laser additive manufacturing (invited)[J]. Infrared and Laser Engineering, 2024, 53(11): 20240432
- Infrared and Laser Engineering
- Vol. 53, Issue 11, 20240432 (2024)
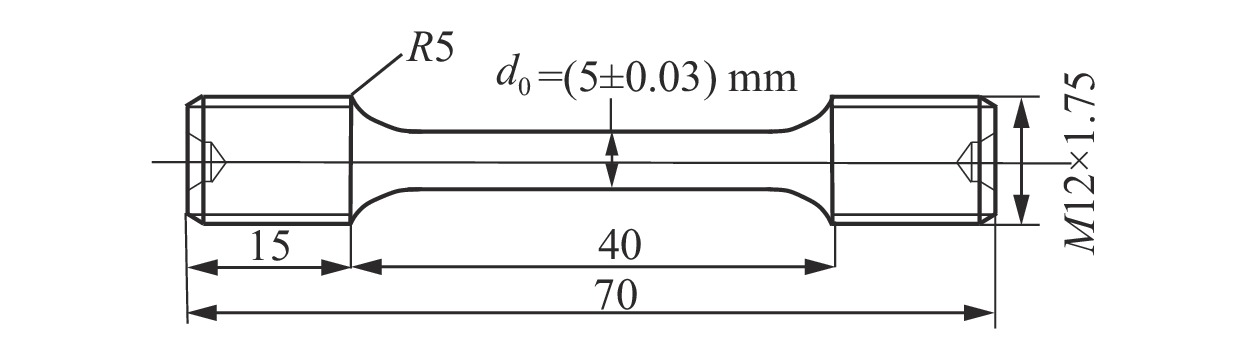
Fig. 1. Drawing of tensile specimen dimensions
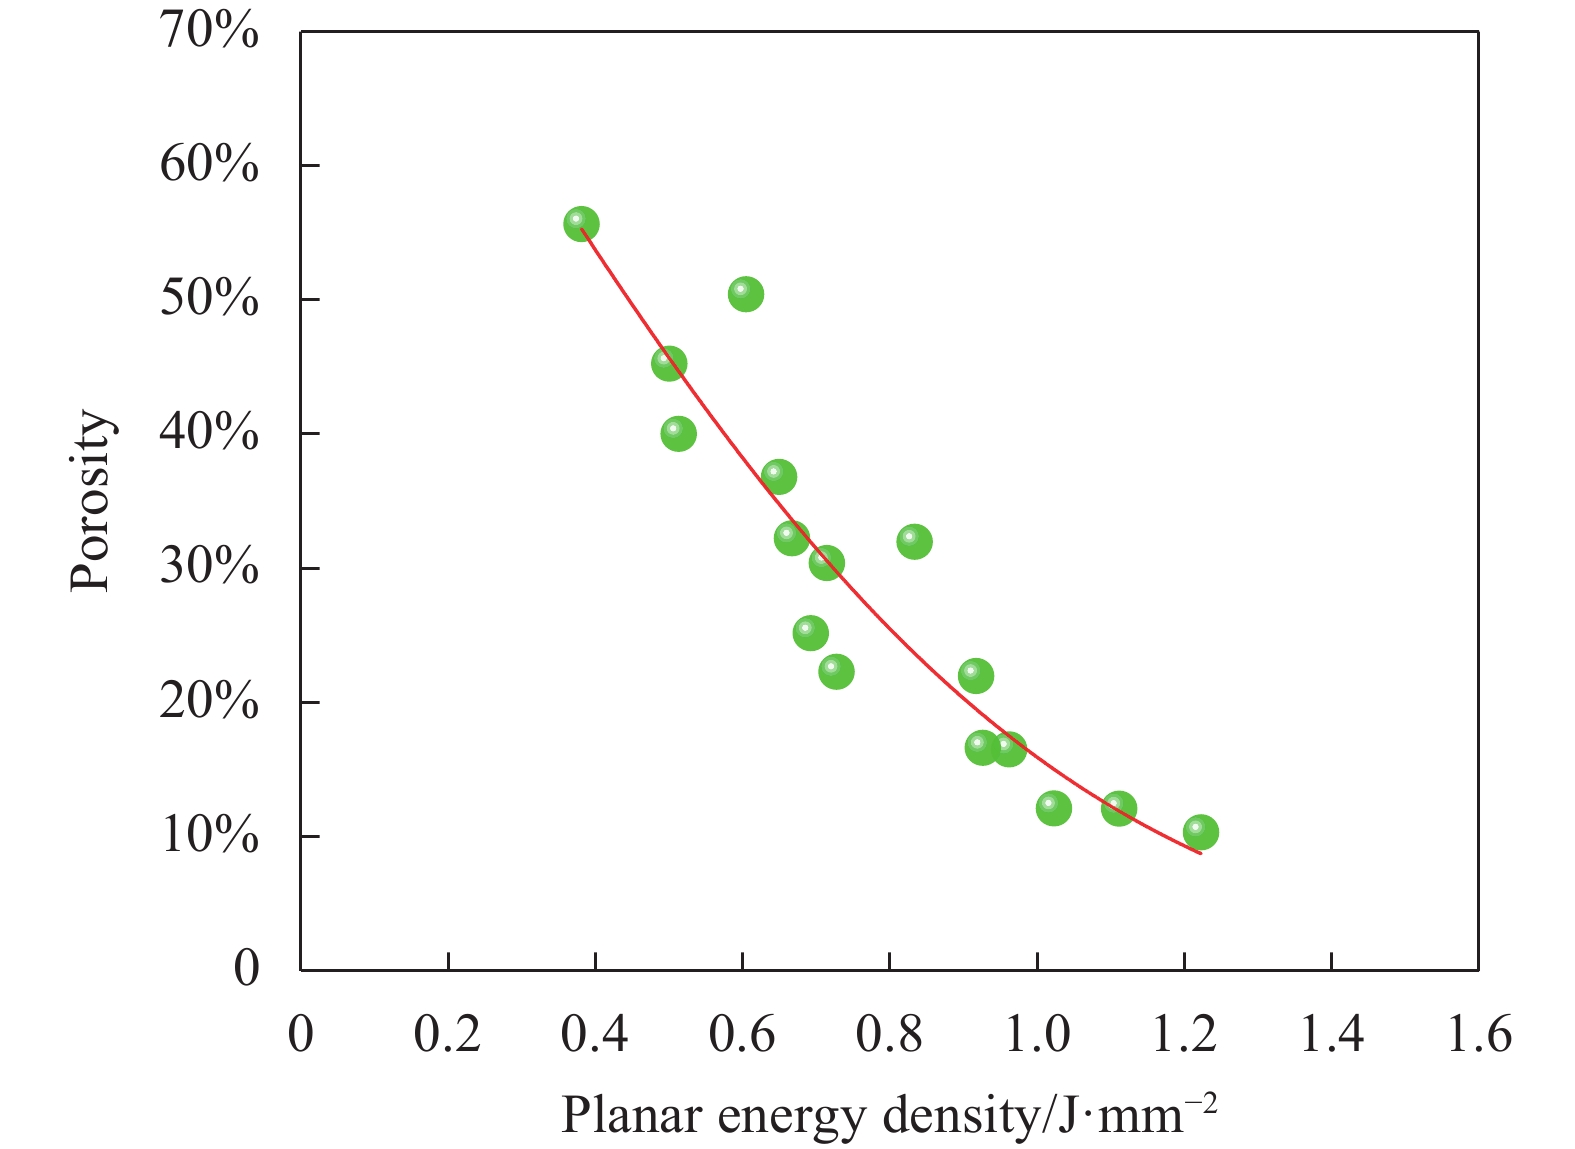
Fig. 2. The relationship between porosity and planar energy density
Fig. 3. Porosity distribution of the samples under different planar energy densities(CT scan results). (a) 0.38 J/mm2-55.65%; (b) 0.83 J/mm2-31.97%; (c) 0.92 J/mm2-21.97%; (d) 1.22 J/mm2-10.33%
Fig. 4. Tensile-tested samples in the as-built condition. (a) Planar energy density of 0.38 J/mm2; (b) Planar energy density of 1.22 J/mm2
Fig. 5. Mechanical properties in the as-built condition. (a) Variation of tensile strength and elongation at break with planar energy density; (b) The relationship between tensile strength and porosity
Fig. 6. Schematic diagram of lattice-reinforced porous structure: (a) Schematic diagram of gyroid-sheet surface[19]; (b) 3D Model of lattice-reinforced porous structure from CT scan
Fig. 7. CT scan images of lattice-reinforced samples. (a) G5; (b) G7; (c) G9
Fig. 8. Mechanical properties of G5-G9 lattice-reinforced samples. (a) Tensile curves of G5-G9 lattice-reinforced porous structure samples and porous structure samples; (b) Tensile strength and elongation at break of G5-G9 lattice-reinforced porous structure samples
Fig. 9. 270x SEM images of fracture of porous structures and lattice-reinforced porous structure samples. (a) Morphology of the fracture of the porous structure sample; (b) Morphology of the fracture of the G5 sample; (c) Morphology of the fracture of the G7 sample; (d) Morphology of the fracture of the G9 sample
Fig. 10. Stress distribution contour maps for models with different porosity
Fig. 11. Schematic diagrams of models with different pore sizes
Fig. 12. Stress distribution contour maps of models with different pore sizes
Fig. 13. Schematic diagram of lattice-reinforced structure
Fig. 14. Stress distribution contour map of the lattice-reinforced model
Fig. 15. Lattice-reinforced porous structure models
Fig. 16. Stress distribution contour map of the lattice-reinforced structure
|
Table 1. Composition of IN718 alloy(wt.%)
| |||||||||||||||||||||||||||||||||||||||||||||||||||||||||||
Table 2. Orthogonal experiment table
|
| ||||||||||||||||||||||||||||||||
Table 4. Simulation model parameters for different porosities
| ||||||||||||||
Table 5. Different pore sizes and compositions


Set citation alerts for the article
Please enter your email address

© Copyright 2018-2021 | Chinese Laser Press. All Rights Reserved 沪ICP备15018463号-20