• Photonics Research
  • Vol. 12, Issue 9, 1962 (2024)
Mingwang Tian1, Xin Xu1, Sihong Chen2, Zhipeng Feng3, and Yidong Tan1,*
Author Affiliations
  • 1State Key Laboratory of Precision Measurement Technology and Instruments, Department of Precision Instrument, Tsinghua University, Beijing 100084, China
  • 2Guangdong Bright Dream Robotics Co., Ltd., Foshan 310018, China
  • 3Guangzhou Modern Information Engineering College, Guangzhou 510000, China
  • show less
    DOI: 10.1364/PRJ.523382 Cite this Article Set citation alerts
    Mingwang Tian, Xin Xu, Sihong Chen, Zhipeng Feng, Yidong Tan, "Ultrasensitive detection of remote acoustic vibrations at 300 m distance by optical feedback enhancement," Photonics Res. 12, 1962 (2024) Copy Citation Text show less
    Schematic diagram of the proposed PLFV. BS, 7:3 (transmittance:reflectance) beam splitter; L1, convex lens; FR, Faraday rotator; HWP, half-wave plate; AOM1, AOM2: acoustic-optic modulators; AP, aperture; L2, concave lens; L3, convex lens; QWP, quarter-wave plate; T, target; PD, photodiode.
    Fig. 1. Schematic diagram of the proposed PLFV. BS, 7:3 (transmittance:reflectance) beam splitter; L1, convex lens; FR, Faraday rotator; HWP, half-wave plate; AOM1, AOM2: acoustic-optic modulators; AP, aperture; L2, concave lens; L3, convex lens; QWP, quarter-wave plate; T, target; PD, photodiode.
    Physical device for the remote vibration measurement experiment. (a) Diagram of the PLFV, the mirrors used to turn the light path, and the target (a common carton) in the corridor, and inside the red frame is the overall schematic diagram of this long-distance vibration measurement experiment. (b), (c) Diagram of mirrors 1–3 used to turn the light path, which makes distance from the target to the PLFV reach 300 m. (d) Diagram of the target.
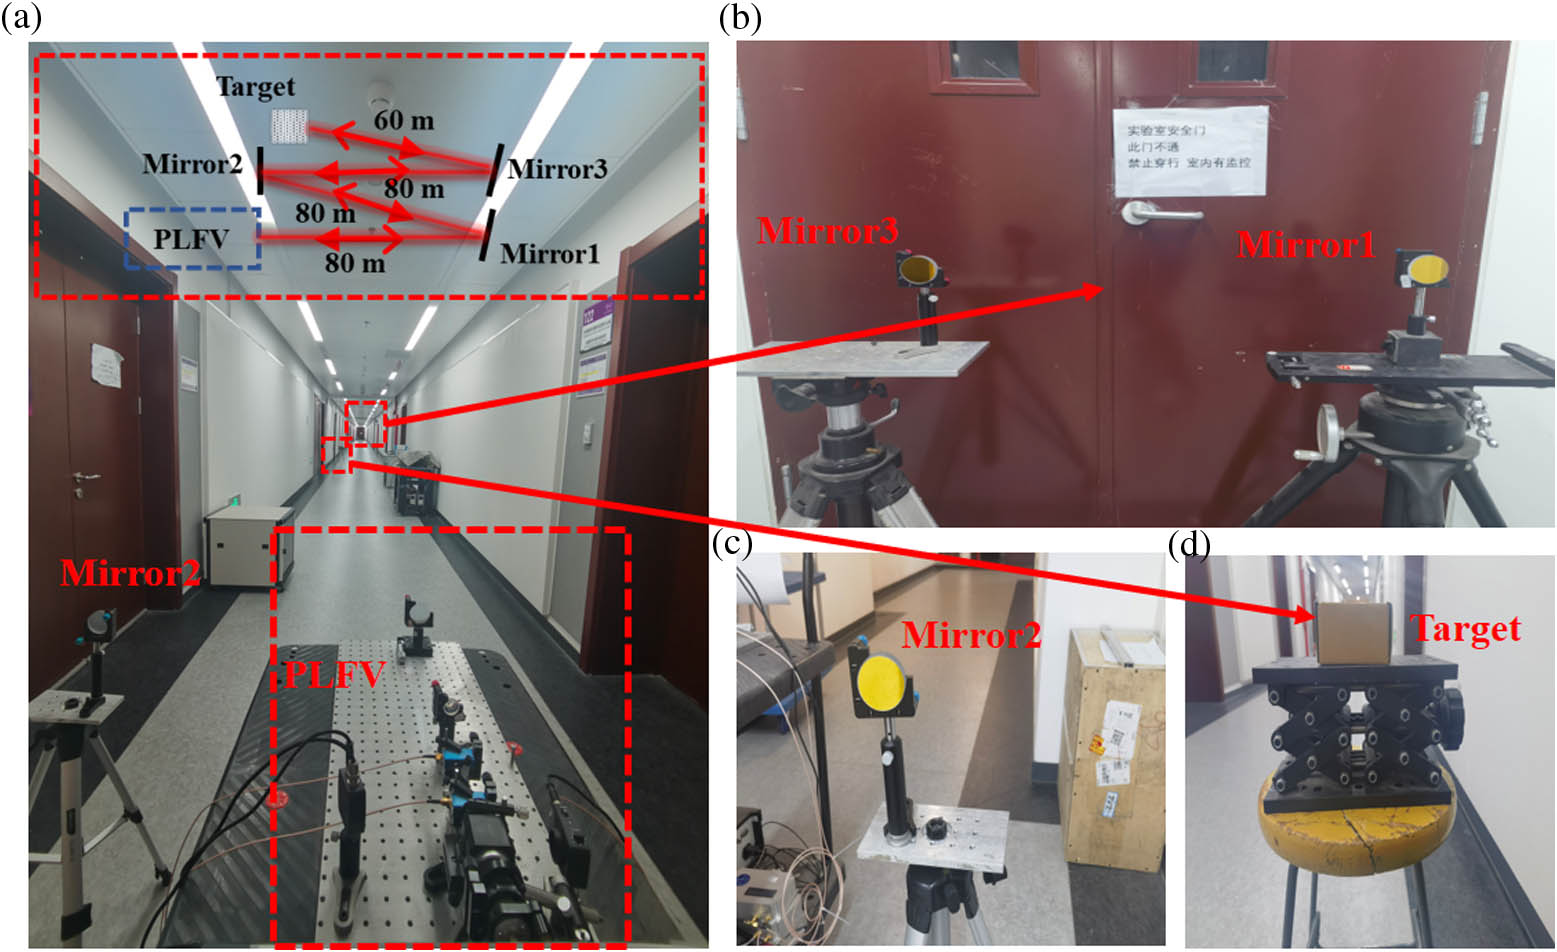
    Fig. 2. Physical device for the remote vibration measurement experiment. (a) Diagram of the PLFV, the mirrors used to turn the light path, and the target (a common carton) in the corridor, and inside the red frame is the overall schematic diagram of this long-distance vibration measurement experiment. (b), (c) Diagram of mirrors 1–3 used to turn the light path, which makes distance from the target to the PLFV reach 300 m. (d) Diagram of the target.
    Result of the signal spectrum for the target (a carton).
    Fig. 3. Result of the signal spectrum for the target (a carton).
    Frequency accuracy test result. (a) Recovered spectrogram of the frequencies at 300 m. (b) Comparison between the measured frequency and the standard frequency. (c) Physical image of the target.
    Fig. 4. Frequency accuracy test result. (a) Recovered spectrogram of the frequencies at 300 m. (b) Comparison between the measured frequency and the standard frequency. (c) Physical image of the target.
    Result of vibration amplitude response sensitivity. The y-axis and x-axis here represent the displacement noise spectral density and the detected frequency, respectively.
    Fig. 5. Result of vibration amplitude response sensitivity. The y-axis and x-axis here represent the displacement noise spectral density and the detected frequency, respectively.
    Test diagram and results at different incident angles. (a) Schematic diagram of testing at different incident angles at 300 m. (b) Recovered spectrogram of the frequencies under 30 deg incidence condition. (c) Comparison between the measured frequency and the standard frequency under 30 deg incidence condition. (d) Recovered spectrogram of the frequencies under 45 deg incidence condition. (e) Comparison between the measured frequency and the standard frequency under 45 deg incidence condition.
    Fig. 6. Test diagram and results at different incident angles. (a) Schematic diagram of testing at different incident angles at 300 m. (b) Recovered spectrogram of the frequencies under 30 deg incidence condition. (c) Comparison between the measured frequency and the standard frequency under 30 deg incidence condition. (d) Recovered spectrogram of the frequencies under 45 deg incidence condition. (e) Comparison between the measured frequency and the standard frequency under 45 deg incidence condition.
    Schematic diagram of anti-wind interference test and test result of the PLFV. (a) Schematic diagram of test principle. (b) The recovered spectrogram of the frequencies in the presence of wind disturbances.
    Fig. 7. Schematic diagram of anti-wind interference test and test result of the PLFV. (a) Schematic diagram of test principle. (b) The recovered spectrogram of the frequencies in the presence of wind disturbances.
    Frequency accuracy test results of different targets and the targets’ physical images. (a) Recovered spectrogram of the frequencies of the PC plastic. (b) Comparison between the measured frequency and the standard frequency of the PC plastic. (c) Physical image of the PC plastic box. (d) Recovered spectrogram of the frequencies of the PET plastic. (e) Comparison between the measured frequency and the standard frequency of the PET plastic. (f) Physical image of the PET plastic bottle.
    Fig. 8. Frequency accuracy test results of different targets and the targets’ physical images. (a) Recovered spectrogram of the frequencies of the PC plastic. (b) Comparison between the measured frequency and the standard frequency of the PC plastic. (c) Physical image of the PC plastic box. (d) Recovered spectrogram of the frequencies of the PET plastic. (e) Comparison between the measured frequency and the standard frequency of the PET plastic. (f) Physical image of the PET plastic bottle.
    Corresponding spectrograms of the demodulated voice signals obtained from an ordinary carton at distances of (a) 80 m, (b) 240 m, and (c) 300 m.
    Fig. 9. Corresponding spectrograms of the demodulated voice signals obtained from an ordinary carton at distances of (a) 80 m, (b) 240 m, and (c) 300 m.
    Errors between measured frequency values and standard acoustic vibration frequency values at different light incidence angles (target as a carton at a distance of 300 m). The y-axis and x-axis represent the deviation value and the standard frequency value, respectively. (a) 0 deg. (b) 30 deg. (c) 45 deg.
    Fig. 10. Errors between measured frequency values and standard acoustic vibration frequency values at different light incidence angles (target as a carton at a distance of 300 m). The y-axis and x-axis represent the deviation value and the standard frequency value, respectively. (a) 0 deg. (b) 30 deg. (c) 45 deg.
    Errors between measured frequency values and standard acoustic vibration frequency values for targets with different materials (PC plastic and PET plastic). The y-axis and x-axis represent the deviation value and the standard frequency value, respectively. (a) PC plastic. (b) PET plastic.
    Fig. 11. Errors between measured frequency values and standard acoustic vibration frequency values for targets with different materials (PC plastic and PET plastic). The y-axis and x-axis represent the deviation value and the standard frequency value, respectively. (a) PC plastic. (b) PET plastic.
    ParameterValue
    Transmittance of the BS ηBS0.7
    Transmittance of the two AOMs ηAOMs0.49
    Transmittance of one lens ηlens0.995
    Transmittance of one wave-plate ηWP0.995
    Transmittance of the Faraday rotator ηFR0.97
    One-way laser transmittance of the PLFV η0.37
    Table 1. Transmittance of Each Element of the PLFV
    DistanceRecognition Results
    80 mIs this your handbag?
    240 mIs this your handbag?
    300 mIs this your handbag?
    Table 2. Recognition Results under Three Different Distances
    Eavesdropping PrincipleEavesdropping Distance
    Video [18]4 m
    Laser LiDAR [22]2.5 m
    Laser Doppler vibrometer [24]150 m
    Millimeter wave radar [34]1.83 m
    Electro-optical sensor [35]25 m
    Power indicator LED [36]35 m
    This paper (PLFV)300 m
    Table 3. Comparison of the Current Methods for Eavesdropping
    Mingwang Tian, Xin Xu, Sihong Chen, Zhipeng Feng, Yidong Tan, "Ultrasensitive detection of remote acoustic vibrations at 300 m distance by optical feedback enhancement," Photonics Res. 12, 1962 (2024)
    Download Citation