• Laser & Optoelectronics Progress
  • Vol. 59, Issue 23, 2314002 (2022)
Linjun Zhong, Yongjie Tao, Ping Jiang, and Leshi Shu*
Author Affiliations
  • School of Mechanical Science and Engineering, Huazhong University of Science & Technology, Wuhan 430074, Hubei , China
  • show less
    DOI: 10.3788/LOP202259.2314002 Cite this Article Set citation alerts
    Linjun Zhong, Yongjie Tao, Ping Jiang, Leshi Shu. Process Parameter Optimization for Oscillating Laser Welding of Aluminum Sheet Considering Carbon Emission[J]. Laser & Optoelectronics Progress, 2022, 59(23): 2314002 Copy Citation Text show less
    Test platform of oscillating laser welding
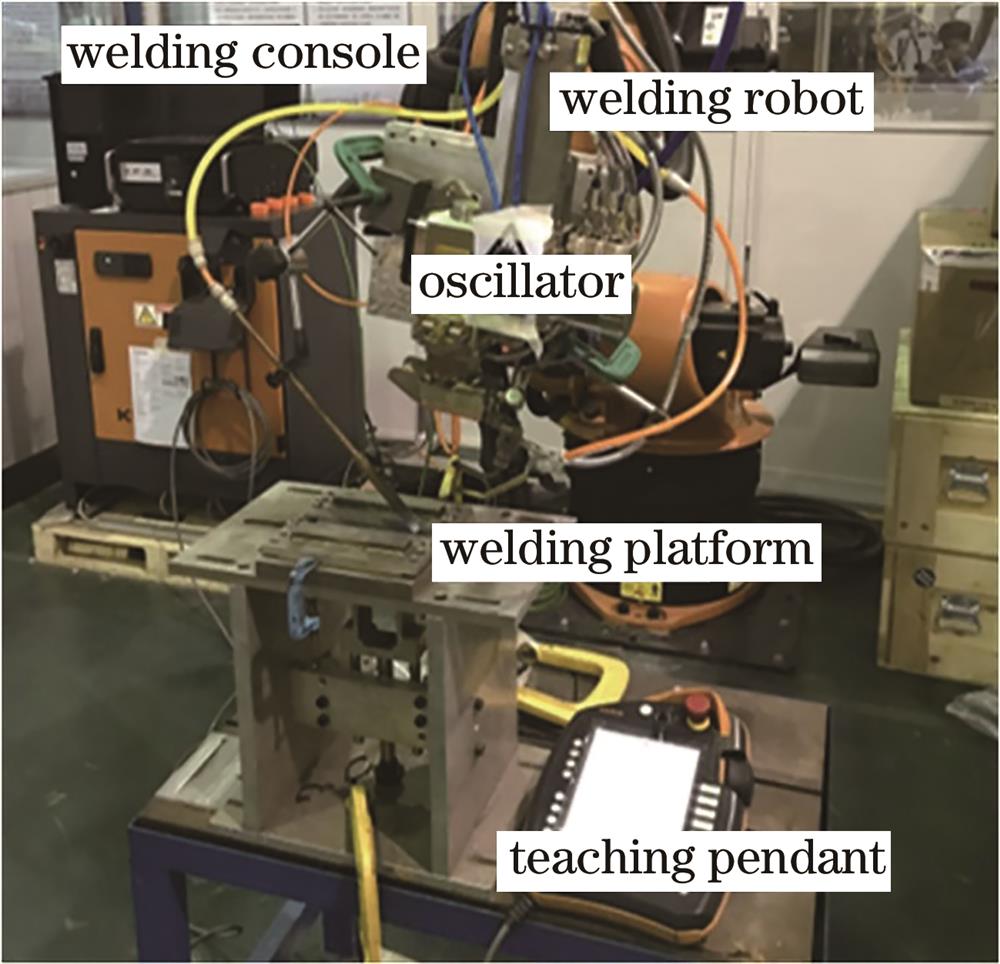
    Fig. 1. Test platform of oscillating laser welding
    Schematic diagram of oscillating laser welding lap joint
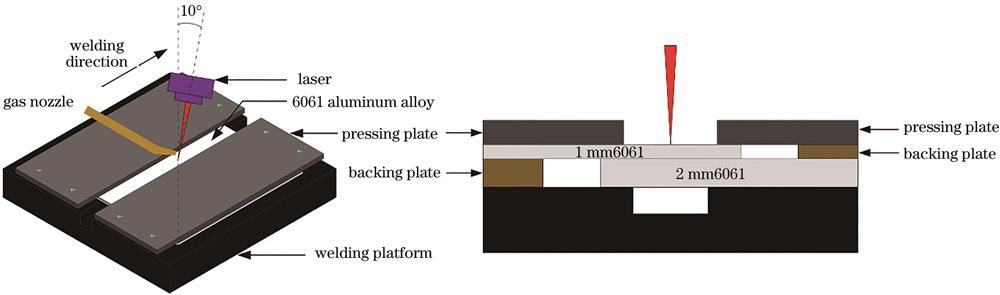
    Fig. 2. Schematic diagram of oscillating laser welding lap joint
    Schematic. (a) Tensile specimen; (b) welded joint
    Fig. 3. Schematic. (a) Tensile specimen; (b) welded joint
    Prediction accuracy of MOGP model. (a) Depth; (b) weld width of lap surface; (c) maximum bearing capacity; (d) carbon emission
    Fig. 4. Prediction accuracy of MOGP model. (a) Depth; (b) weld width of lap surface; (c) maximum bearing capacity; (d) carbon emission
    Pareto set obtained by NSGA-II
    Fig. 5. Pareto set obtained by NSGA-II
    Tensile test results of welded joints with optimized process parameters
    Fig. 6. Tensile test results of welded joints with optimized process parameters
    Weld surface morphology. (a) After optimization; (b) before optimization
    Fig. 7. Weld surface morphology. (a) After optimization; (b) before optimization
    Microstructure at fusion line of optimized process parameters
    Fig. 8. Microstructure at fusion line of optimized process parameters
    Joint hardness distributions before and after optimization of process parameters. (a) Horizontal hardness distribution; (b) vertical hardness distribution
    Fig. 9. Joint hardness distributions before and after optimization of process parameters. (a) Horizontal hardness distribution; (b) vertical hardness distribution
    Test results of maximum joint bearing capacity
    Fig. 10. Test results of maximum joint bearing capacity
    Carbon emission content test results of welding process
    Fig. 11. Carbon emission content test results of welding process
    Contribution of welding process parameters on different welding results. (a) Depth; (b) weld width of lap surface; (c) maximum bearing capacity; (d) carbon emission
    Fig. 12. Contribution of welding process parameters on different welding results. (a) Depth; (b) weld width of lap surface; (c) maximum bearing capacity; (d) carbon emission
    ElementMgSiFeCuMnCrZnTiAl
    Mass fraction /%1.150.650.70.350.150.30.250.15Bal.
    Table 1. Chemical composition of 6061 aluminum alloy for experiment
    StatusTensile strength /MPaYield strength /MPaMicrohardness /MPaElongation /%
    6061-T6309.5279.28511.96
    Table 2. Mechanical properties of 6061 aluminum alloy for experiment
    No.Power /kWSpeed /(mm·s-1Frequency /HzAmplitude /mmDepth /μmWidth /μmBearing capacity /kNCarbon emission /g
    14.2742.82261.6171020855.3334.858
    24.7944.92402.1153822805.4735.502
    34.1549.51041.8217926875.3632.312
    44.8844.61182.4200729844.7634.179
    54.3543.21132.5172628364.9034.464
    64.5046.01692.0159923175.1433.158
    74.6840.71461.6248326495.2935.719
    84.5952.01511.9185222694.7530.710
    94.7450.61082.4199528554.3731.097
    104.9448.11882.4152724455.4132.757
    114.9149.22021.8186222685.2331.705
    124.5340.42121.9171123235.1435.420
    135.0042.51742.0211725555.3135.734
    144.1841.4992.1186327725.2334.604
    154.2141.11792.3134623895.4334.768
    164.0951.31841.8141220585.3430.039
    174.1241.81551.7201925784.9634.480
    184.7142.11932.4146425455.0835.206
    194.2947.41601.5198223274.9131.397
    204.4447.81652.511084621.4432.476
    214.9748.81272.0230126944.9633.148
    224.6240.01322.1200527034.8336.608
    234.4747.1852.1239729174.9532.480
    244.4148.52351.7155519635.0431.774
    254.0045.72071.9129221355.6232.613
    264.2451.71222.2152523805.1230.373
    Table 3. Sample point data of weld morphology size, maximum joint bearing capacity, and carbon emission
    No.P /kWV /(mm·s-1F /HzA /mmType of valuesResults
    ECE /gDDP /μmWBW /μmF /kN
    1#4.8548.8862.3Predicted value32.121222530904.76
    Actual value31.736231031484.87
    Relative error /%1.23.71.82.3
    2#4.06521062.0Predicted value31.506174326465.72
    Actual value30.892170022965.32
    Relative error /%2.02.515.27.5
    Table 4. Relative error results of optimal process parameter combination
    Linjun Zhong, Yongjie Tao, Ping Jiang, Leshi Shu. Process Parameter Optimization for Oscillating Laser Welding of Aluminum Sheet Considering Carbon Emission[J]. Laser & Optoelectronics Progress, 2022, 59(23): 2314002
    Download Citation