 AI Video Guide
  AI Picture Guide
 AI One Sentence

Matthew Willetts, Anthony S. Atkins. Evaluation of a software positioning tool to support SMEs in adoption of big data analytics[J]. Journal of Electronic Science and Technology, 2024, 22(1): 100229
- Journal of Electronic Science and Technology
- Vol. 22, Issue 1, 100229 (2024)
Note: This section is automatically generated by AI . The website and platform operators shall not be liable for any commercial or legal consequences arising from your use of AI generated content on this website. Please be aware of this.
Abstract
1 Introduction
Small and medium sized enterprises (SMEs) represent 90% of all businesses worldwide [1], and 99% of businesses in the UK [2], USA [3], and European Union [4]. However, studies have found that big data analytics has been adopted by only 10% of SMEs [5,6] despite the benefits which have been reported including faster and cheaper development of products [7], dynamic pricing, fraud detection, and improved stock control [8]. The big data analytics framework for SMEs in the UK (HBDAF-UKSMEs) was developed to help SMEs adopt the technology and converted into a scoring tool [9,10]. Its application has been documented in case studies for two SMEs in the UK who have adopted big data analytics [11,12]. The motivation for this paper is to present an evaluation of the proposed HBDAF-UKSMEs framework based on the structured feedback from a focus group composed of experienced practitioners mainly from SMEs (6 companies) but also including some practitioners from large companies. The design of the evaluation is discussed including the selection of the evaluation criteria based on human computer interaction (HCI) characteristics and elements of the technology adoption model (TAM) [13]. The evaluation criteria selected are as follows: Easy to learn, easy to use, usefulness, comprehensiveness, adaptability, and intention to use. The design of the supporting evaluation template which was developed to record the structured feedback from the participants is also discussed together with the selection of participants involved in the evaluation. The results of the evaluation are presented with a discussion.
2 Big data adoption by small and medium sized enterprises
Big data is defined as ‘an umbrella term used to describe a wide range of technologies that capture, store, transform, and analyse complex data sets which can be of a high volume, generated at a high velocity in a variety of formats’ [9]. Big data has been described as having three characteristics known as the three Vs: Volume, velocity, and variety. The three Vs have been extended with additional Vs including value and veracity, with the number of Vs utilised by different publications currently reaching 51 [14]. Prominent drivers of big data are Internet of things (IoT), smart devices [5,15], and social media [16]. Big data analytics is the process of extracting insights from big data, a widely utilised definition is ‘a new generation of technologies and architectures, designed to economically extract value from very large volumes of a wide variety of data, by enabling high velocity capture, discovery, and/or analysis’ [17].
SME is typically classified as a business with less than 250 employees [18]. In the UK, SMEs represent 99% of all businesses (6 million) and employ 61% of the country’s workforce, generating over half of the turnover of the UK’s private sector (£2.1 trillion) [2]. It is widely documented that large businesses worldwide have reported numerous benefits of adopting big data analytics including faster and cheaper development of products [7], dynamic pricing, fraud detection and improved stock control [8], customer demand forecasting, and supplier defect tracking [19]. However, big data analytics is not widely adopted by SMEs due to barriers to adoption including financial barriers, lack of top management support, lack of expertise, and lack of awareness [20–23]. There are case studies of SMEs who have successfully adopted big data analytics, achieving benefits such as cheaper and faster product development [7], sensing opportunities and threats, expanding into new markets, and achieving competitive advantages [24]. However, the literature of big data analytics is primarily focused on large companies [19].
3 Background research
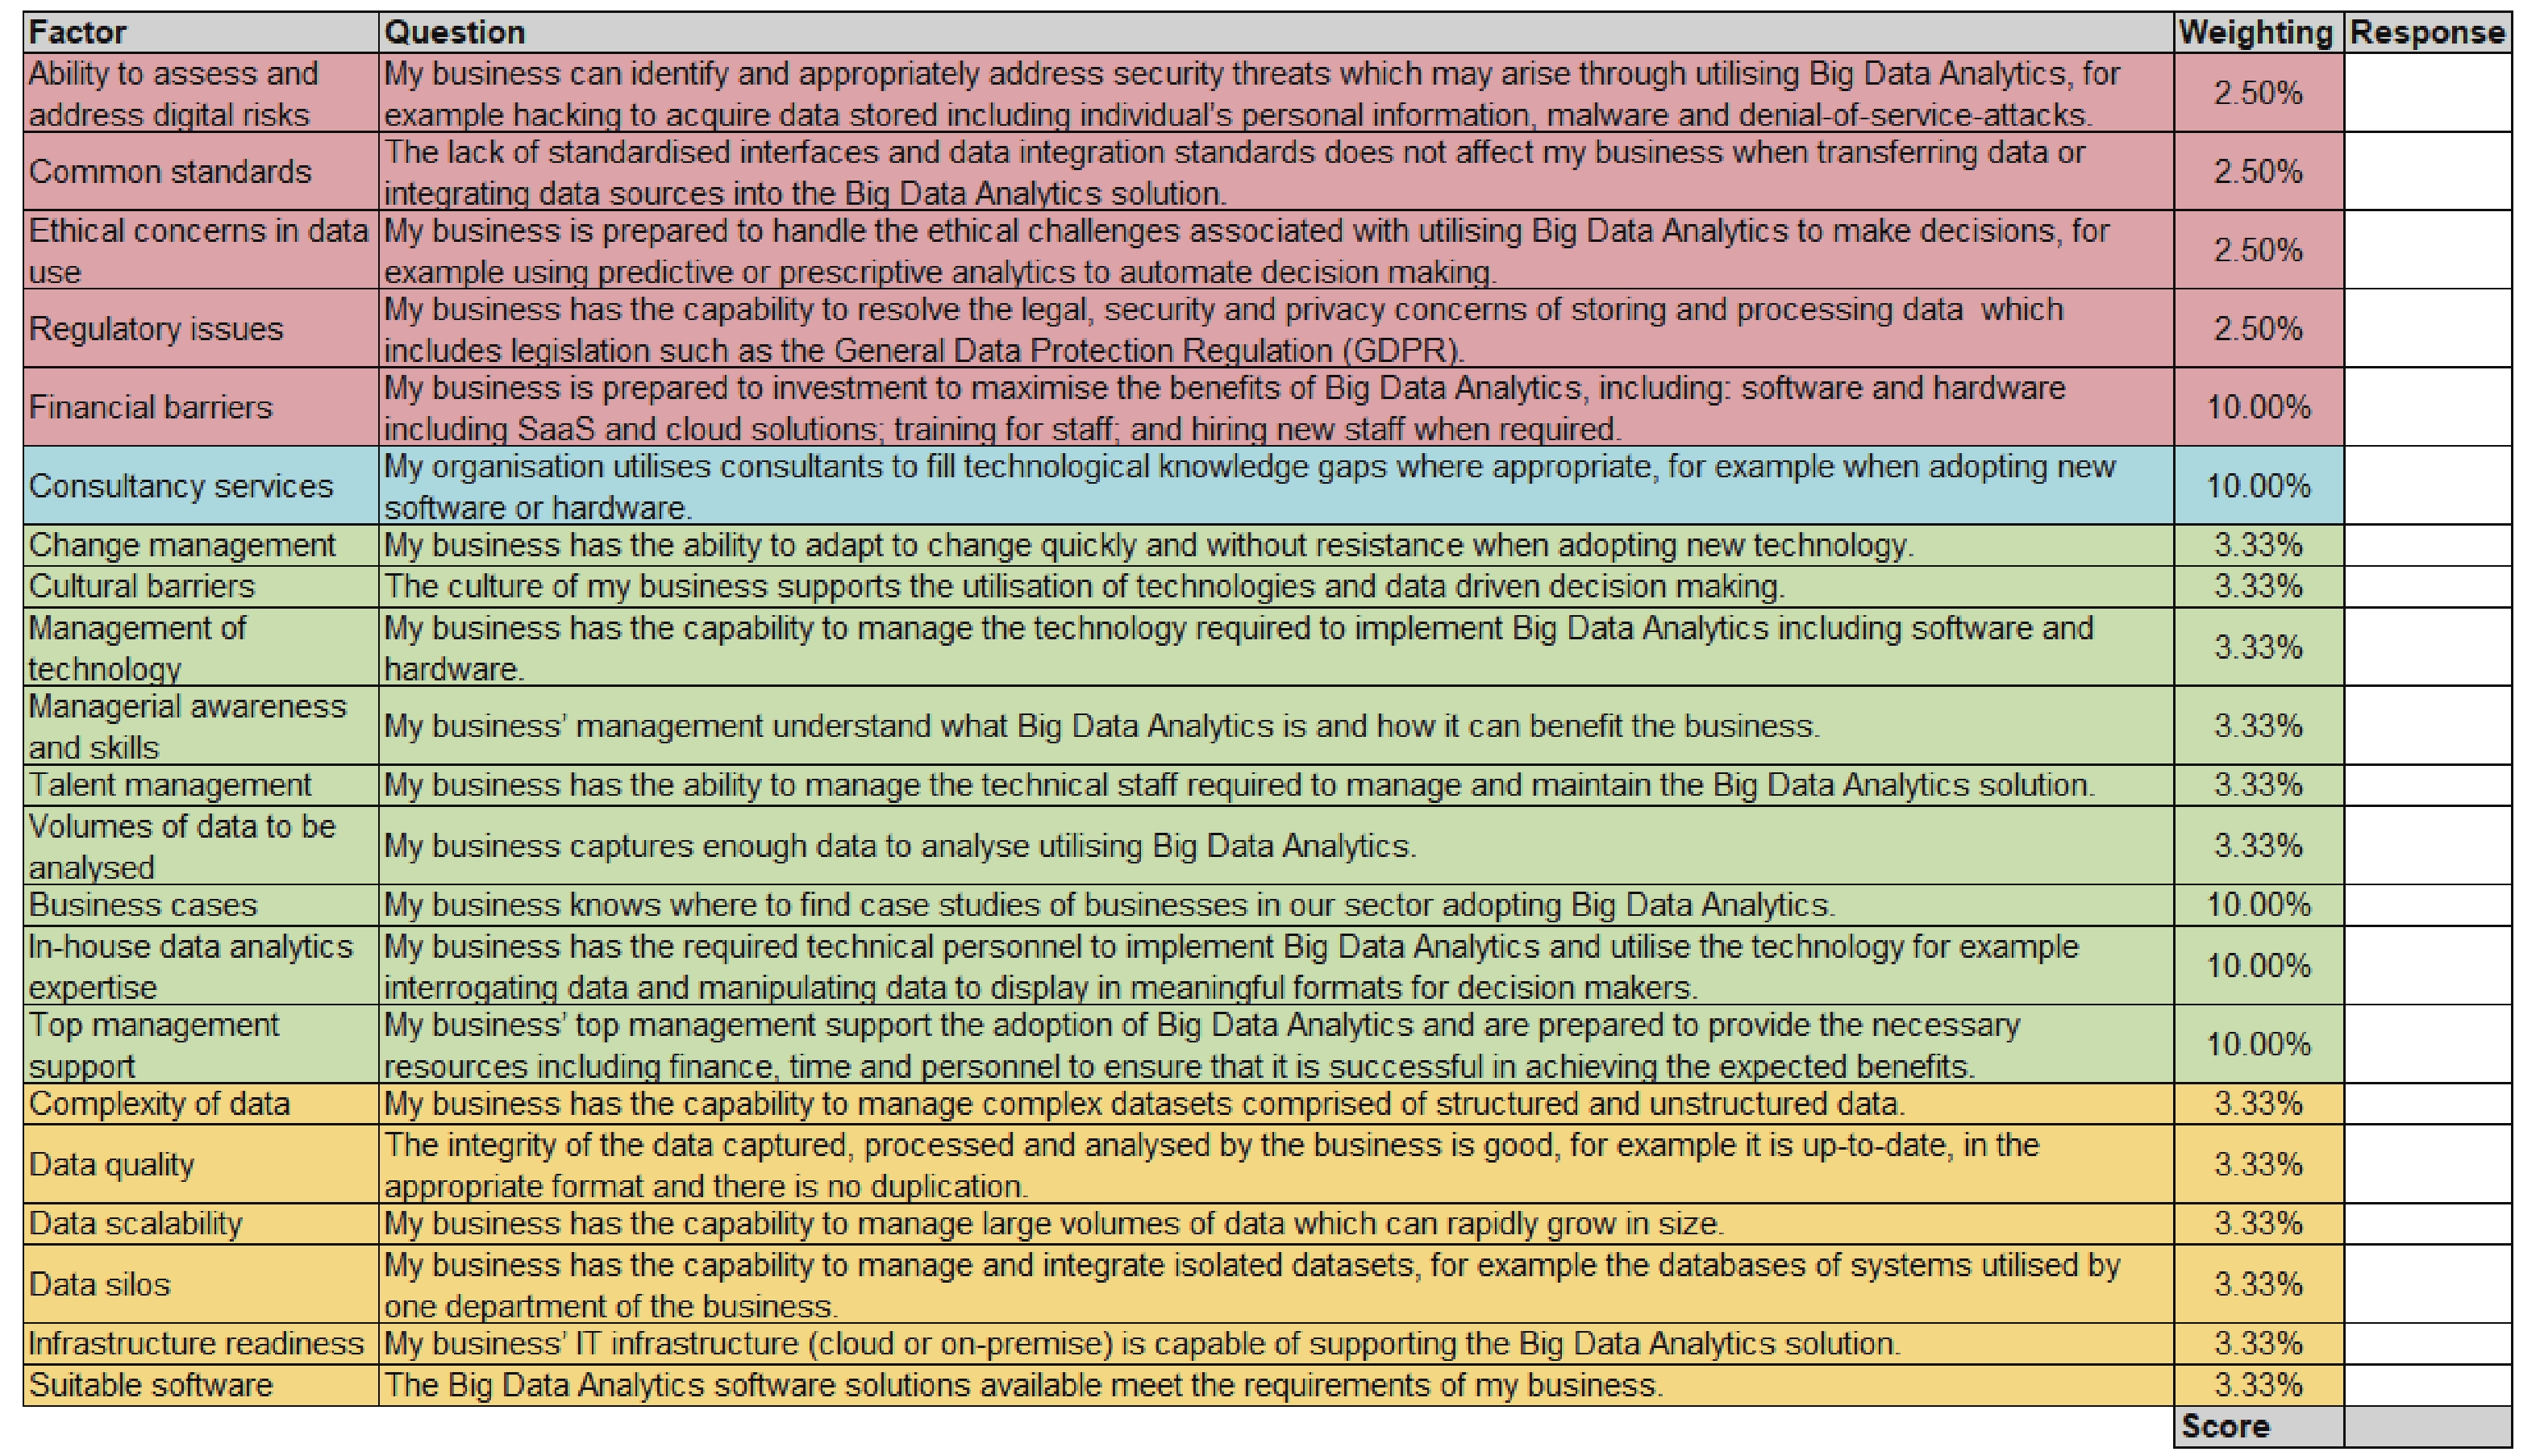
To overcome the barriers to big data analytics adoption by SMEs, an extensive literature review was undertaken to identify the barriers to adoption [9,21], of which 69 were identified and rationalised to 21 utilising a thematic analysis outlined by Bruan and Clarke [25]. The big data analytics framework for SMEs in the UK (BDAF-UKSMEs) was developed utilising the barriers identified, which was then validated quantitatively by undertaking a questionnaire which was fully completed by 105 SMEs in the UK and qualitatively by interviewing ten representatives from SMEs in the UK for the purposes of triangulation. The framework was modified based on the feedback received from SMEs and a positioning tool was developed [10] which was applied to two real-world SMEs and documented in case studies [11,12]. The outputs of the tool were also applied to benchmarking and the balanced scorecard [26]. The purpose of this paper is to document the evaluation of the framework using the feedback from practitioners and SME representatives to confirm if the positioning tool satisfies the purpose it was designed for and to capture any feedback so that it can be improved. Fig. 1 shows a screenshot of the scoring tool. The pillars derived from three theoretical frameworks (human, organisation and technology-fit, technology-organisation-environment model, and information systems strategy triangle) to provide theoretical underpinning [27]. Each pillar comprises of one or more factors relating to the barriers to big data analytics adoption. Each factor has a weighting assigned to which was developed through a community of practice (CoP) team and a Delphi approach [28] and applied the weightings to a positioning study to refine them until they provided an appropriate fit to the scenario [10]. There is a corresponding question for each factor which the user answers with a score between 1 and 5 (1—very low; 2—low; 3—medium; 4—high; 5—very high) which is multiplied by the weighting to calculate a score for the factor. The sum of the 21 scores for each barrier produced a number between 1 and 5 which represents the business’ analytics maturity.
![]()
Figure 1.Scoring tool screenshot
To demonstrate the application of HBDAF-UKSMEs, a positioning study is outlined based on one real-world SME in the UK. The positioning study was developed in a focus group with six academics and SME practitioners, similarly to a CoP team [29] which aligns with Nielsen’s [30] recommendation that a focus group should consist of six to nine participants. The positioning study is based on a real-world Web development company in the UK which develops websites for companies both domestically and internationally, known in this positioning study as Company X. Three stages are outlined in this study: Initial pre-data analytics stage where the business conducted basic analytics utilising Microsoft Excel, the second stage where business intelligence was introduced through the adoption of a social media analytics suite, such as Hootsuite [31] to perform descriptive analytics, and the third stage where the business progressed to utilising big data analytics through the sentiment analysis to identify positive and negative sentiment in social media posts relating to the business and its competitors. Fig. 2 shows a screenshot of the scores input for the third stage into the spreadsheet tool. The final score is derived by averaging the summation of all the factors (multiplying the weight to the corresponding response), so they can be used for ranking purposes in relation to information technology (IT) investment.
![]()
Figure 2.Screenshot of the score entry sheet with the scores for the third stage of the positioning study.
3.1 Stage 1: Ad Hoc analytics
Company X is a small, family-owned Web development company in the UK and the company has been trading for over 15 years. The company develops company websites for businesses of all sizes mostly in the UK with a small number of businesses internationally. The business had a portfolio of clients from SMEs to large businesses including high-profile high-street retailers. The websites integrate with a variety of systems and continually grow the number of integrations they offer through the use of application programming interfaces (APIs). The business consisted of 15 staff, primarily IT and development staff which were supported by customer services, business development, finance, and sales staff. The business maintained a sustainable volume of work from its existing client base without needing to take on new clients. The company had a high level of IT literacy and knowledge of legislation, such as the general data protection regulation (GDPR) [32] and data protection act [33], to ensure the business remained compliant. The business did not initially utilise the businesses intelligence software apart from Microsoft Excel for Ad-Hoc sales and financial reporting. The business captured a range of data including sales and marketing.
3.2 Stage 2: Business intelligence
The business merged with another web development company which resulted in a restructure of the business. As a result, Company X doubled their portfolio of clients and increased its staff to 25. The sales and marketing manager from the business which Company X merged with were experienced in utilising the social media analytics software and suggested that the business should take advantage of social media as a way to grow the business and engage with customers. Some of the features Company X could exploit included the ability to post social media posts to multiple social media networks and the reporting of the impact of the posts. Social media consists of 12.69% of all Internet traffic and a considerable contribution to creating 328.77 million terabytes each day [34]. Therefore, Company X has access to the huge volumes of freely available social media big data. As Company X’s competitors also utilised social media analytics, it was decided to invest in this software too and Google Ads. Although social media analytics is a form of big data analytics [35], Company X was primarily using descriptive analytics in the social media analytics software to produce reports on the effectiveness of its social media. At this point, Company X progressed into Stage 2 where it was utilising business intelligence reporting to show summaries of their social media effectiveness.
3.3 Stage 3: Big data analytics
From this point, Company X has continued to advance its analytics maturity by transitioning to Stage 3: Big data analytics. The business hired an additional social media executive to manage its social media and assist with online marketing and reporting on social media posting effectiveness. The business invested further in social media analytics by purchasing additional functionality and training. The sentiment analysis is a form of big data analytics used on social media [36] and was one of the most useful features Company X adopted which enabled the business to identify positive and negative sentiment in social media posts. For example, posts with negative sentiment relating to its competitors gave them opportunities to intervene and promote its services to dissatisfied customers. The social media executive setup dashboards and monitored alerts which allow the business to intervene in real time to events. The investment in social media analytics allowed Company X to gain measurable improvements from Stage 3, resulting in increased profitability. Fig. 3 shows the scores for the 3 stages in the case study.
![]()
Figure 3.Scores for the 3 stages.
4 Development of the evaluation methodology for the positioning tool for big data analytics adopted by SMEs
4.1 Development of the evaluation criteria
The terms, validation and evaluation, are used interchangeably by some researchers, however other researchers have differentiated the two [37]. Evaluation in the context of this research is the acceptance of HBDA-UKSMEs by its end users, which are SMEs, and the satisfaction of its performance [38]. This paper provides the evaluation of the framework and scoring tool developed by a focus group of SME and non-SME practitioners from a variety of SMEs and large companies. The purpose of the evaluation is to ensure that the scoring tool developed is intuitive to use, as its purpose is to help SMEs to adopt big data analytics. The scoring tool developed is the implementation of HBDAF-UKSMEs, therefore this was required to be evaluated to ensure that it was intuitive, holistic, and fit-for-purpose to be used by SMEs in the UK particularly for those which lack technical knowledge and are unsure of the benefits of big data analytics. The tool assists in giving quantitative assurance to justify investment in this technology and help to gain competitive advantages. Additionally, it was also crucial to confirm if SMEs would utilise the scoring tool if they were in a position to, as if the evaluation participants did not think they would use it, then it is unlikely SMEs in the UK would. Two of the barriers to SMEs adoption of big data analytics are ‘lack of managerial awareness and skills’ and ‘lack of in-house data analytics expertise’, therefore the scoring tool needs to be easy to learn and use due to the comments made by SMEs. Therefore suitable acceptance criteria from HCI literature were identified to ascertain the important aspects of the HBDAF-UKSMEs framework, predominantly utilising aspects from Nielsen’s guidance on human interface design [39–41] as they are widely accepted [42,43]. Similarly, TAM has been utilised in many technology adoption studies including big data analytics [44] and SMEs adoption of technology [45]. Therefore, some of the evaluation criteria originated from TAM and its variants. The evaluation criteria are listed with supporting literature studies in Table 1 [30,46–49].
| Evaluation criteria | Definition | Reference |
| Easy to learn | The extent to which the participant believes that SMEs in the UK can learn how to use HBDAF-UKSMEs and the scoring tool. | [ |
| Easy to use | The extent to which the user believes that the HBDAF-UKSMEs scoring tool is easy to use. | [ |
| Usefulness | The extent to which the participant believes that HBDAF-UKSMEs would be beneficial for SMEs in the UK. | [ |
| Comprehensiveness | The extent to which the participant believes that HBDAF-UKSMEs incorporate all of the barriers encountered by SMEs in the UK to adopting big data analytics. | [ |
| Adaptability | SMEs can operate in different sectors such as manufacturing or retail, and the size of the business can vary. Therefore, adaptability represents the degree to which the participant believes that the scoring tool can be adapted by different SMEs. | [ |
| Intention to use | The extent to which the participant believes SMEs in the UK will utilise the HBDAF-UKSMEs scoring tool. | [ |
Table 1. Evaluation criteria.
4.2 Design of the evaluation
It was decided that the most suitable approach to capture evaluation feedback was to undertake semi-structured focus group meetings with participants from SME and non-SME practitioners. The advantage of conducting semi-structured focus group meetings is that the participants may provide richer feedback, for example explaining why they chose the answers, and provide additional, richer commentary on their views of the scoring tool based on the framework. The feedback was captured independently through a standardised evaluation template listing the evaluation criteria outlined in subsection 4.1 and the design of the evaluation template will be discussed in subsection 4.3.
A standard presentation was developed to explain to the focus group participants the scoring tool based on the framework. The presentation showed the third version of HBDAF-UKSMEs, the scoring tool, a case study documented in Ref. [11], and the evaluation criteria. This ensured that the same process was repeated to ensure consistency between the evaluation interview sessions. The sessions were conducted remotely using Microsoft Teams and Zoom. An evaluation template was developed for the focus group participants to complete feedback after the delivery of the presentation.
4.3 Design of the evaluation template
An evaluation template was presented to the participants at the end of the interview for feedback. As the presentations were delivered virtually over Microsoft Teams and Zoom, the template was produced as a Microsoft Word file which was shared with the participants over the video calls by the researcher sharing their screen with the participant. The participants stated their answers verbally which were recorded by the author. The first section enquired about the participant job title, if they were working for SMEs and which business sector their companies operate in. The second section of the template presented the user with the six evaluation options derived from the criteria outlined in Table 2 and asked them to score each item from 1 and 5 (with 5 the highest score for ‘very easy’). The final section of the template asked the user to provide any additional feedback on the scoring tool and performance measurement. The evaluation template was pilot tested with one participant to review the process and to check that there were no ambiguities or inconsistencies in the questions before the template was utilised for the evaluation.
| Question | 1 | 2 | 3 | 4 | 5 | Participant score |
| How easy is it to learn? | Very difficult | Difficult | Neither difficult nor easy | Easy | Very easy | |
| How easy is it to use? | Very difficult | Difficult | Neither difficult nor easy | Easy | Very easy | |
| How useful is it to SMEs in the UK? | Not at all useful | Not useful but could be with substantial modification | Useful but would require some modification | Useful | Very useful | |
| How comprehensive is the scoring tool and framework? | Not at all | Not sufficiently comprehensive as important elements are missing | Fairly comprehensive | Comprehensive | Very comprehensive | |
| How easy is the framework and scoring tool to adapt to your business? | Very difficult | Difficult | Neither difficult nor easy | Easy | Very easy | |
| How likely would you be to use the framework and scoring tool if you were in a position to? | Very unlikely | Unlikely | Neither unlikely nor likely | Likely | Very likely |
Table 2. Five-point evaluation template.
4.4 Participants
Ten participants were selected from a variety of different SMEs and large companies in different sectors. This is more than the recommended number of participants suggested by Nielsen [48], who suggested five is sufficient. However, SMEs operate in a wide range of sectors and range from micro companies (ten or less employees) to medium-sized businesses. The quantitative [6] and qualitative analysis [49] displayed the diversity of SMEs and their potential utilisation of big data analytics in the 2 case studies previously outlined [11,12]. Therefore, it seemed sensible to utilise practitioners in different domains hence the number of 10 was chosen for this research. A representative from both companies documented in the case studies participated in the evaluation. The majority of the participants were working for SMEs, however, some of the participants were working for large businesses in statistical and IT disciplines. This also provided an opportunity to compare the responses between SMEs and large businesses. The participants of the evaluation are listed in Table 3, indicating their job category.
| No. | Participant’s position | Work for SME | Category | Domain |
| 1 | Business owner | Yes | SME practitioner | Recruitment |
| 2 | Head transport planner | Yes | SME practitioner | Logistics |
| 3 | Office manager | Yes | SME practitioner | Automotive |
| 4 | Project manager | Yes | SME practitioner | Higher manufacturing |
| 5 | Statistician | No | Analytical | Healthcare |
| 6 | Accountant | Yes | Analytical | Finance |
| 7 | IT manager | Yes | IT management | Education |
| 8 | IT manager | No | IT management | Education |
| 9 | Senior IT support officer | No | IT specialist | Parcels |
| 10 | Geographic mapping information system’s officer | No | IT specialist | Local government |
Table 3. Participants.
4.5 Analysis of the results
The purpose of the evaluation was to evaluate the implementation of the proposed HBDAF-UKSMEs framework through the development of the scoring tool based on the evaluation criteria outlined in subsection 4.1. The overall feedback for the ten participants is shown in Fig. 4.
![]()
Figure 4.Overall evaluation of the framework and scoring tool.
4.5.1 Feedback from evaluation
This subsection discusses the feedback received for each of the six evaluation criteria.
• Easy to learn
All of the participants indicated that the scoring tool based on HBDAF-UKSMEs was easy to learn. Seven of the participants scored the ‘easy to learn’ criteria 4 and three of the participants scored it 5. As none of the participants scored this criterion less than 4, it appears that the framework and scoring tool are easy to learn. Therefore, no major improvements are required. One of the participants commented that: ‘This framework stands to provide a lot of useful information with minimal overhead. It is set out in a way that is easy to understand, akin to a risk assessment form if anything’.
• Easy to use
All of the participants agreed that the scoring tool was easy to use. One of the participants commented that: ‘The tool is set out with ease of use in mind’. Six of the participants scored ‘easy to use’ as 4 and the remaining four participants scored it 5. The participants believed that the software tool was easy to use as the user simply had to select a score between 1 and 5 for each of the 21 factors and the final score was calculated for them.
• Usefulness
All of the participants believed that the scoring tool will be useful to SMEs. One of the participants commented: ‘My organisation is just starting to take advantage of data analytics. Many of the staff responsible for this range from not massively IT literate, to being so busy that they need something fast that can provide them with data they can easily take into the next business performance meeting. I can see the use of something like this becoming the norm as time goes on’. Seven of the participants scored the ‘usefulness’ 4 and the remaining three participants scored it 5.
• Comprehensiveness
All of the participants believed the scoring tool incorporated all of the factors which would influence SME adopting big data analytics. They were aware of the 21 barriers to adoption identified throughout the research process and how these barriers have been renamed to now represent enabling factors in the scoring tool. Seven of the participants scored ‘comprehensiveness’ as 4 and the remaining three participants scored this 5.
• Adaptability
The majority of the participants believed that the scoring tool could be adopted for their businesses and SMEs in a wide range of sectors. The majority of the participants believed the scoring tool could easily be adapted, as additional factors could be added, or the weightings could be changed if required. Only one participant scored ‘adaptability’ 3, with six scoring it 4 and the remaining three participants scoring it 5.
• Intention to use
The majority of the participants would use the scoring tool if they were in a position to. Not all of the participants were in a senior management position, therefore they would not be able to easily influence the top tier of management in their current roles, whereas other participants were in a position to adopt the tool. Only one participant scored ‘intention to use’ 3, with five scoring it 4 and the remaining four participants scoring it 5. Table 4 presents the scores for all six evaluation criteria.
| Criteria | 1 | 2 | 3 | 4 | 5 |
| Easy to learn | 0 | 0 | 0 | 7 | 3 |
| Easy to sse | 0 | 0 | 0 | 6 | 4 |
| Usefulness | 0 | 0 | 0 | 7 | 3 |
| Comprehensiveness | 0 | 0 | 0 | 7 | 3 |
| Adaptability | 0 | 0 | 1 | 6 | 3 |
| Intention to use | 0 | 0 | 1 | 5 | 4 |
Table 4. Evaluation scores.
4.5.2 Comparison between categories
The findings from the ten participants show that the scoring tool based on HBDAF-UKSMEs meets the evaluation criteria outlined. However, there were some minor differences between the three groups of participants. The SME practitioner group scored ‘easy to use’, ‘comprehensiveness’, and ‘adaptability’ higher than the other groups. The analytical staff scored ‘easy to learn’, ‘usefulness’, and ‘intention to use’ the highest. They scored ‘adaptability’ and ‘easy to use’ the lowest out of the three groups. The IT group did not score any of the six criteria higher than the other groups, but they did score ‘comprehensiveness’ the lowest with an average score of 4.25. However, as the average score for each criterion is 4 or higher across all of the groups, this would suggest that generally each group believe that the framework and scoring tool meet the evaluation criteria. The comparison of the average scores between the three participant groups are shown in Fig. 5.
![]()
Figure 5.Comparison between the analytical, IT, and SME practitioner groups.
4.5.3 Comparison between SME and non-SME participants
Six of the participants were working for SMEs and four were working for large businesses. The scores between SMEs and large businesses were compared to see if there were any major differences. Interestingly, SMEs generally scored higher than the large companies with only ‘intention to use’ scoring lower than the participants from large companies. Although SMEs were very interested in using the tool, it is surprising that the participants from large companies scored ‘intention to use’ higher. Fig. 6 shows the comparison between the participants from SMEs and large businesses.
![]()
Figure 6.Comparison between the participants from SMEs and large businesses.
5 Discussion
This paper commenced with a summary of big data analytics adoption by SMEs and background research of the development of the HBDAF-UKSMEs framework which has been designed to help SMEs overcome the barriers to big data analytics adoption. The application of the scoring tool developed from the framework has been demonstrated through a case study of a small website development company’s adoption of big data analytics. Each successive stage displays an increase in the analytics capability and is reflected by the increase in the score calculated. The purpose of the evaluation is to ensure that the scoring tool developed is intuitive to use, as its purpose is to help SMEs to adopt big data analytics. An evaluation template was designed based on the evaluation criteria discussed in this paper and a presentation was developed to show to ten participants from mainly SMEs and some large businesses. The scores received from the participants were analysed both collectively and by splitting the participants into groups based on their job roles and the size of the business they were working for.
The evaluation documented in this paper has demonstrated that the implementation of HBDAF-UKSMEs through the scoring tool meets the six evaluation criteria outlined, with an average score of over 4 for each received. However, some of the participants provided further feedback on how they believed the scoring tool could be improved or adapted.
Firstly, it was suggested that as SMEs operate in a diverse range of sectors including manufacturing, retail, and construction, personalised scoring tools based on the type of business might provide greater assistance to SMEs than a generic scoring tool. Developing a scoring tool for each sector was beyond the scope of this research project, therefore a generic approach was taken to develop a framework and scoring tool which could be adopted by any SME in the UK. However, this suggestion could be expanded upon in future research.
Secondly, one of the participants believed that as some of the questions on the scoring tool are difficult to measure, it may be difficult to answer accurately. The participant believed that some factors, such as organisational culture, may be difficult to score. However, none of the other participants suggested that they had any difficulty understanding or scoring any of the questions. Further testing may be required to gain further feedback which may lead to a revision of the scoring tool in future work.
Lastly, another participant suggested that it would be useful if the thresholds were provided that businesses should target to be ready for different stages of big data implementation. For example, a score of less than 2 would suggest that SME is not ready to adopt big data analytics, whereas a score of 2.5 would suggest that they are able to undertake business intelligence-like techniques such as descriptive analytics on big datasets. This suggests that the score produced by the scoring tool could translate to a stage on a maturity model.
6 Conclusion
SMEs play a vital role in both the global economy and in the case of the UK, because SMEs represent 99% of all businesses (6 million) and employ 61% of the country’s workforce, generating over half of the turnover of the UK’s private sector (£2.1 trillion). However, big data analytics has been adopted by only 10% of SMEs despite the benefits reported which could help them to gain competitive advantages. A positioning tool has been developed as outlined in the paper with the aim in helping SMEs overcome the barriers reported. The case study documented in this paper outlines the results of using the positioning tool for a small web development company to ascertain the investment in big data analytics. Consequently, an evaluation was required to ensure that the scoring tool developed is intuitive to use, as its purpose is to help SMEs to adopt big data analytics. A methodology was developed for evaluating the usability of a positioning tool to support SMEs in big data analytics. The tool was evaluated by several practitioners who were either working for SMEs or for large companies in analytical or IT roles. The evaluation documented in this paper has demonstrated that the implementation of HBDAF-UKSMEs through the scoring tool meets the six evaluation criteria outlined, with an average score of over 4 (max 5) for each criterion received. The outcome of the evaluation was that the participants agreed that the tool was intuitive to use as well as comprehensive, and they were likely to use it to help them in investment decisions in big data analytics adoption in SMEs. However, there were a number of suggestions as to how the scoring tool could be improved, including creating specific versions for different industries and providing thresholds for different stages of big data analytics adoption. Hopefully, this tool will help and support SMEs to increase the application of business intelligence and big data analytics to achieve competitive advantages. Future work will document further case studies on the application of the scoring tool in different business sectors of SMEs and the development of a maturity model.
Disclosures
The authors declare no conflicts of interest.
References
[1] The Wld Bank, Small medium enterprises (SMEs) finance [Online]. Available, https:www.wldbank.gentopicsmefinance, September 2022.
[2] M. Ward, G. Hutton, Business statistics [Online]. Available, https:commonslibrary.parliament.ukresearchbriefingssn06152, January 2023.
[3] ganisation f Economic Cooperation Development, Financing SMEs entrepreneurs 2022: An OECD sceboard [Online]. Available, https:www.oecdilibrary.gsites8ae4e97denindex.htmlite=contentcomponent8ae4e97den, September 2022.
[4] European Commission, Entrepreneurship small mediumsized enterprises (SMEs)| Internal market, industry, entrepreneurship SMEs [Online]. Available, https:ec.europa.eugrowthsmesen, May 2021.
[5] M. Bianchini, V. Michalkova, OECD SME entrepreneurship papers, No. 15 data analytics in SMEs: Trends policies [Online]. Available, https:doi.g10.1787f493861een, June 2019.
[6] M. Willetts, A.S. Atkins, C. Stanier, Quantitative study on barriers of adopting big data analytics f UK Eire SMEs, in: N. Sharma, A. Chakrabarti, V.E. Balas, A.M. Bruckstein (Eds.), Data Management, Analytics Innovation, Springer, Singape, 2022, pp. 349–373.
[7] Improving new product development using big data: A case study of an electronics company. R&D Manage, 47, 570-582(2017).
[8] Editial Team, How Amazon used big data to rule Ecommerce [Online]. Available, https:insidebigdata.com20191130howamazonusedbigdatatoruleecommerce, December 2019.
[9] M. Willetts, A.S. Atkins, C. Stanier, A strategic big data analytics framewk to provide opptunities f SMEs, in: Proc. of 14th Intl. Technology, Education Development Conf., Valencia, 2020, pp. 3033–3042.
[10] Software positioning tool to support SMEs in adoption of big data analytics using a case study application. International Journal of Software Engineering & Computer System, 9, 46-58(2023).
[11] M. Willetts, A.S. Atkins, C. Stanier, A teaching learning case study on data mining using association rules f SMEs, in: Proc. of 16th Intl. Technology, Education Development Conf., Valencia, 2022, pp. 1401–1410.
[12] M. Willetts, A.S. Atkins, C. Stanier, Teaching learning case study on social media analytics f small mediumsized enterprises, in: Proc. of 14th Annual Intl. Conf. of Education, Research Innovation, Seville, 2021, pp. 3158–3167.
[13] F.D. Davis, A Technology Acceptance Model f Empirically Testing New Enduser Infmation Systems: They Results, Ph.D. dissertation, Massachusetts Institute of Technology, Cambridge, USA, 1986.
[14] M. Willetts, A.S. Atkins, C. Stanier, Big data, big data analytics application to smart home technologies services f geriatric rehabilitation, in: M.A. Choukou, S. SyedAbdul (Eds.), Smart Home Technologies Services f Geriatric Rehabilitation, Academic Press, London, 2022, pp. 205–230.
[16] Social media big data analytics: A survey. Comput. Hum. Behav., 101, 417-428(2019).
[18] M. Ward, C. Rhodes, Small businesses the UK economy [Online]. Available, https:researchbriefings.files.parliament.ukdocumentsSN06078SN06078.pdf, December 2014.
[21] M. Willetts, A.S. Atkins, C. Stanier, Barriers to SMEs adoption of big data analytics f competitive advantage, in: Proc. of 4th Intl. Conf. on Intelligent Computing in Data Sciences, Fez, 2020, pp. 1–8.
[23] M. Iqbal, S.H.A. Kazmi, A. Manzo, A.R. Soomrani, S.H. Butt, K.A. Shaikh, A study of big data f business growth in SMEs: Opptunities & challenges, in: Proc. of Intl. Conf. on Computing, Mathematics Engineering Technologies, Sukkur, 2018, pp. 1–7.
[25] Using thematic analysis in psychology. Qual. Res. Psychol., 3, 77-101(2006).
[26] Journal of Data. Information and Management, 5, 55-69(2023).
[28] Qualitative Delphi method: A four round process with a worked example. The Qualitative Report, 22, 2755-2763(2017).
[29] E. Wenger, B. TraynerWenger, Communities of practice: A brief introduction [Online]. Available, http:www.wengertrayner.comwpcontentuploads20150407Briefintroductiontocommunitiesofpractice.pdf, July 2021.
[30] J. Nielsen, Usability Engineering, Academic Press, Boston, 1993.
[31] Hootsuite, Social media management dashboard [Online]. Available, https:www.hootsuite.comengb, January 2021.
[32] IT Governance, Brexit, GDPR & data protection: What you need to know [Online]. Available, https:www.itgovernance.co.ukeugdprukdpa2018ukgdpr, October 2020.
[33] GOV.UK, Data protection: The data protection act [Online]. Available, https:www.gov.ukdataprotection, September 2023.
[34] F. Duarte, Amount of data created daily (2023) [Online]. Available, https:explodingtopics.comblogdatageneratedperday, September 2023.
[36] B. Kahan, Exerpts from: Review of evaluation framewks, Saskatchewan Ministry of Education (2008) [Online]. Available, https:kau.edu.saGetFile.aspxid=170971&Lng=AR&fn=evaluationframewksreview.pdf, March 2008.
[38] J. Nielsen, 10 usability heuristics f user interface design [Online]. Available, https:www.nngroup.comarticlestenusabilityheuristics, November 2021.
[39] J. Nielsen, Severity ratings f usability problems [Online]. Available, https:www.nngroup.comarticleshowtoratetheseverityofusabilityproblems, November 1994.
[40] C. Jimenez, P. Lozada, P. Rosas, Usability heuristics: A systematic review, in: Proc. of 11th Colombian Computing Conf., Popayan, 2016, pp. 1–8.
[41] A. Abulfaraj, A. Steele, Detailed usability heuristics: A breakdown of usability heuristics to enhance comprehension f novice evaluats, in: Proc. of 22nd Intl. Conf. on HumanComputer Interaction, Copenhagen, 2020, pp. 3–18.
[42] V. Brock, H.U. Khan, Big data analytics: Does ganizational fact matters impact technology acceptance J. Big Data 4 (1) (Jul. 2017) 21:1–28.
[43] Small medium enterprises technology acceptance model: A conceptual review. Int. J. Bus. Soc., 19, 689-699(2018).
[44] J.P. Chin, V.A. Diehl, K.L. Nman, Development of an instrument measuring user satisfaction of the humancomputer interface, in: Proc. of SIGCHI Conf. on Human Facts in Computing Systems, Washington, 1988, pp. 213–218.
[45] A theoretical extension of the technology acceptance model: Four longitudinal field studies. Manage. Sci., 46, 186-204(2000).
[48] J. Nielsen, Why you only need to test with 5 users [Online]. Available, https:www.nngroup.comarticleswhyyouonlyneedtotestwith5users, October 2021.
[49] Qualitative study on barriers of adopting big data analytics for UK SMEs. Intl. Journal of Big Data Management, 3, 28-50(2023).


Set citation alerts for the article
Please enter your email address

© Copyright 2018-2021 | Chinese Laser Press. All Rights Reserved 沪ICP备15018463号-20