Author Affiliations
1School of Microelectronics, Tianjin University, Tianjin 300072, China2Tianjin Fieldbus Control Technology Engineering Center, Tianjin Vocational and Technical Normal University, Tianjin 300222, Chinashow less
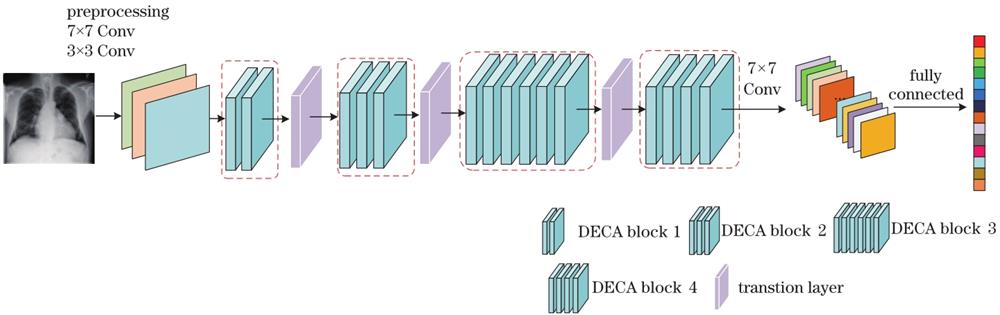
Fig. 1. Framework diagram of chest disease classification network
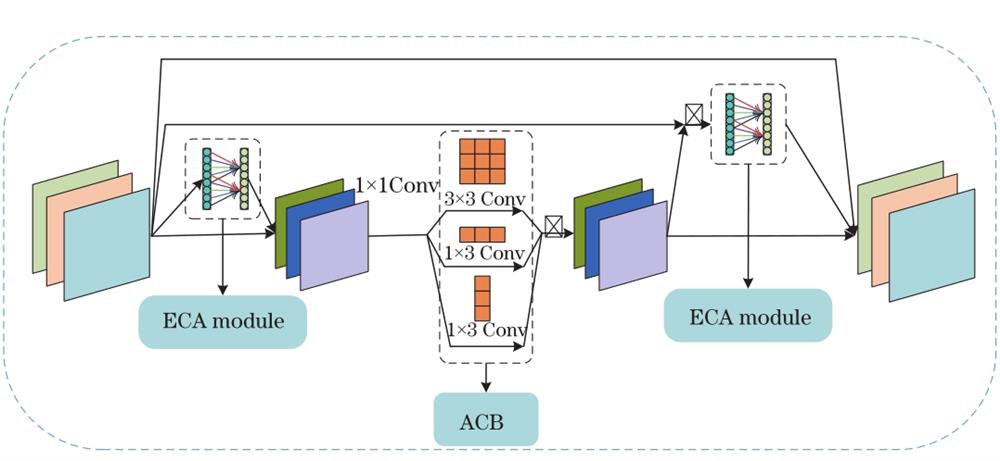
Fig. 2. Structure of DECA
Fig. 3. 5-layer dense connected block, each layer taking all the preceding feature-maps as input
Fig. 4. Efficient channel attention module
Fig. 5. Schematic diagram of asymmetric convolution
Fig. 6. X-ray images in Chest X-ray 15 dataset. (a) No finding; (b) pneumonia;(c) COVID-19; (d) cardiomegaly; (e) hernia; (f) infiltration;(g) nodule; (h) emphysema; (i) effusion; (j) pleural thickening; (k) pneumothorax; (l) mass; (m) fibrosis; (n) edema; (o) consolidation
Fig. 7. ROC curve and AUC value of proposed algorithm. (a) Atelectasis; (b) cardiomegaly; (c) effusion; (d) infiltration; (e) mass; (f) nodule; (g) pneumonia; (h) pneumothorax; (i) consolidation; (j) edema; (k) emphysema; (l) fibrosis; (m) pleural thickening: (n) hernia; (o) COVID-19
| Layer | Output size | DECANet-121 |
|---|
| Convolution | 112×112 | 7×7 Conv,stride 2 | | Pooling | 56×56 | 3×3 max pool,stride 2 | | DECA block 1 | 56×56 | | | Transition layer 1 | 56×56 | 1×1 Conv | | 28×28 | 2×2 average pool,stride 2 | | DECA block 2 | 28×28 | | | Transition layer 2 | 28×28 | 1×1 Conv | | 14×14 | 2×2 average pool,stride 2 | | DECA block 3 | 14×14 | | | Transition layer 3 | 14×14 | 1×1 Conv | | 7×7 | 2×2 average pool,stride 2 | | DECA block 4 | 7×7 | | | Classification layer | 1×1 | 7×7 global average pool,stride 2 | | 15 fully-connected |
|
Table 1. Specific structure of DECA-Net
| Network | Backbone | Average AUC |
|---|
| ResNet50 | ResNet50 | 0.7468 | | ResNet50+SE | ResNet50 | 0.7642 | | ResNet50+ECA DenseNet121 | ResNet50 DenseNet121 | 0.7886 0.7952 | | DenseNet121+SE[10] | DenseNet121 | 0.8014 | | DECA-Net | DenseNet121 | 0.8245 |
|
Table 2. Comparison of classification results of different classification network models on Chest X-ray 15
| Disease | Algorithm of reference[9] | Algorithm of reference[10] | Algorithm of reference[13] | Algorithm of reference[18] | Algorithm of reference[19] | Algorithm of reference[20] | Algorithm of reference[21] | Proposedalgorithm |
|---|
| Atelectasis | 0.7003 | 0.7627 | 0.785 | 0.767 | 0.783 | 0.791 | 0.785 | 0.8157 | | Cardiomegaly | 0.81 | 0.8835 | 0.8766 | 0.883 | 0.884 | 0.898 | 0.887 | 0.8657 | | Effusion | 0.7585 | 0.8159 | 0.8628 | 0.828 | 0.832 | 0.873 | 0.831 | 0.8701 | | Infiltration | 0.6614 | 0.6786 | 0.673 | 0.709 | 0.708 | 0.700 | 0.703 | 0.6948 | | Mass | 0.6933 | 0.8012 | 0.804 | 0.821 | 0.837 | 0.832 | 0.833 | 0.8350 | | Nodule | 0.6687 | 0.7293 | 0.7299 | 0.758 | 0.800 | 0.758 | 0.798 | 0.7683 | | Pneumonia | 0.658 | 0.7097 | 0.7423 | 0.731 | 0.735 | 0.767 | 0.731 | 0.7548 | | Pneumothorax | 0.7993 | 0.8377 | 0.8426 | 0.846 | 0.866 | 0.859 | 0.881 | 0.8687 | | Consolidation | 0.7032 | 0.7443 | 0.7846 | 0.745 | 0.746 | 0.800 | 0.754 | 0.7952 | | Edema | 0.8052 | 0.8414 | 0.8727 | 0.835 | 0.841 | 0.889 | 0.849 | 0.8647 | | Emphysema | 0.833 | 0.8836 | 0.858 | 0.895 | 0.937 | 0.891 | 0.930 | 0.8942 | | Fibrosis | 0.7859 | 0.8007 | 0.7754 | 0.818 | 0.82 | 0.789 | 0.833 | 0.8141 | | Pleural thickening | 0.6835 | 0.7536 | 0.7563 | 0.761 | 0.796 | 0.771 | 0.782 | 0.7872 | | Hernia | 0.8717 | 0.8763 | 0.8645 | 0.896 | 0.895 | 0.896 | 0.921 | 0.9027 | | Mean | 0.7451 | 0.7941 | 0.802 | 0.807 | 0.82 | 0.822 | 0.823 | 0.8237 |
|
Table 3. Comparison of AUC value of different chest disease classification algorithms on Chest X-ray 14 dataset
| Disease | Network_1 | Network_2 | Network_3 | Network_4 | DECA-Net |
|---|
| Atelectasis | 0.7853 | 0.7838 | 0.7974 | 0.8073 | 0.8101 | | Cardiomegaly | 0.8770 | 0.8702 | 0.8813 | 0.8877 | 0.8919 | | Effusion | 0.8541 | 0.8498 | 0.8614 | 0.8689 | 0.8701 | | Infiltration | 0.6696 | 0.6724 | 0.6845 | 0.6946 | 0.6892 | | Mass | 0.8128 | 0.8090 | 0.8306 | 0.8302 | 0.8301 | | Nodule | 0.739 | 0.7244 | 0.7595 | 0.7534 | 0.7672 | | Pneumonia | 0.7282 | 0.7355 | 0.7450 | 0.7412 | 0.7389 | | Pneumothorax | 0.8546 | 0.8623 | 0.8743 | 0.8806 | 0.8829 | | Consolidation | 0.7818 | 0.7849 | 0.7908 | 0.7975 | 0.7931 | | Edema | 0.8633 | 0.8872 | 0.8726 | 0.8805 | 0.8782 | | Emphysema | 0.8742 | 0.8829 | 0.8924 | 0.9023 | 0.9122 | | Fibrosis | 0.7722 | 0.7892 | 0.7859 | 0.796 | 0.8054 | | Pleural thickening | 0.7607 | 0.7788 | 0.7627 | 0.7707 | 0.7851 | | Hernia | 0.8571 | 0.9011 | 0.9004 | 0.8678 | 0.8893 | | COVID-19 | 0.8265 | 0.8157 | 0.8273 | 0.8357 | 0.8239 | | Mean | 0. 8038 | 0.8098 | 0.8177 | 0.8210 | 0.8245 |
|
Table 4. Comparison of ablation experiment results