
Li-cheng LI, Hai-yang GAO, Ling-bing BU, Qi-lin ZHANG, Zhen WANG. Inversion of Rotational Temperature in Airglow Layer Based on O2(0-1) Atmospheric Band Spectrum[J]. Spectroscopy and Spectral Analysis, 2020, 40(10): 3002
- Spectroscopy and Spectral Analysis
- Vol. 40, Issue 10, 3002 (2020)
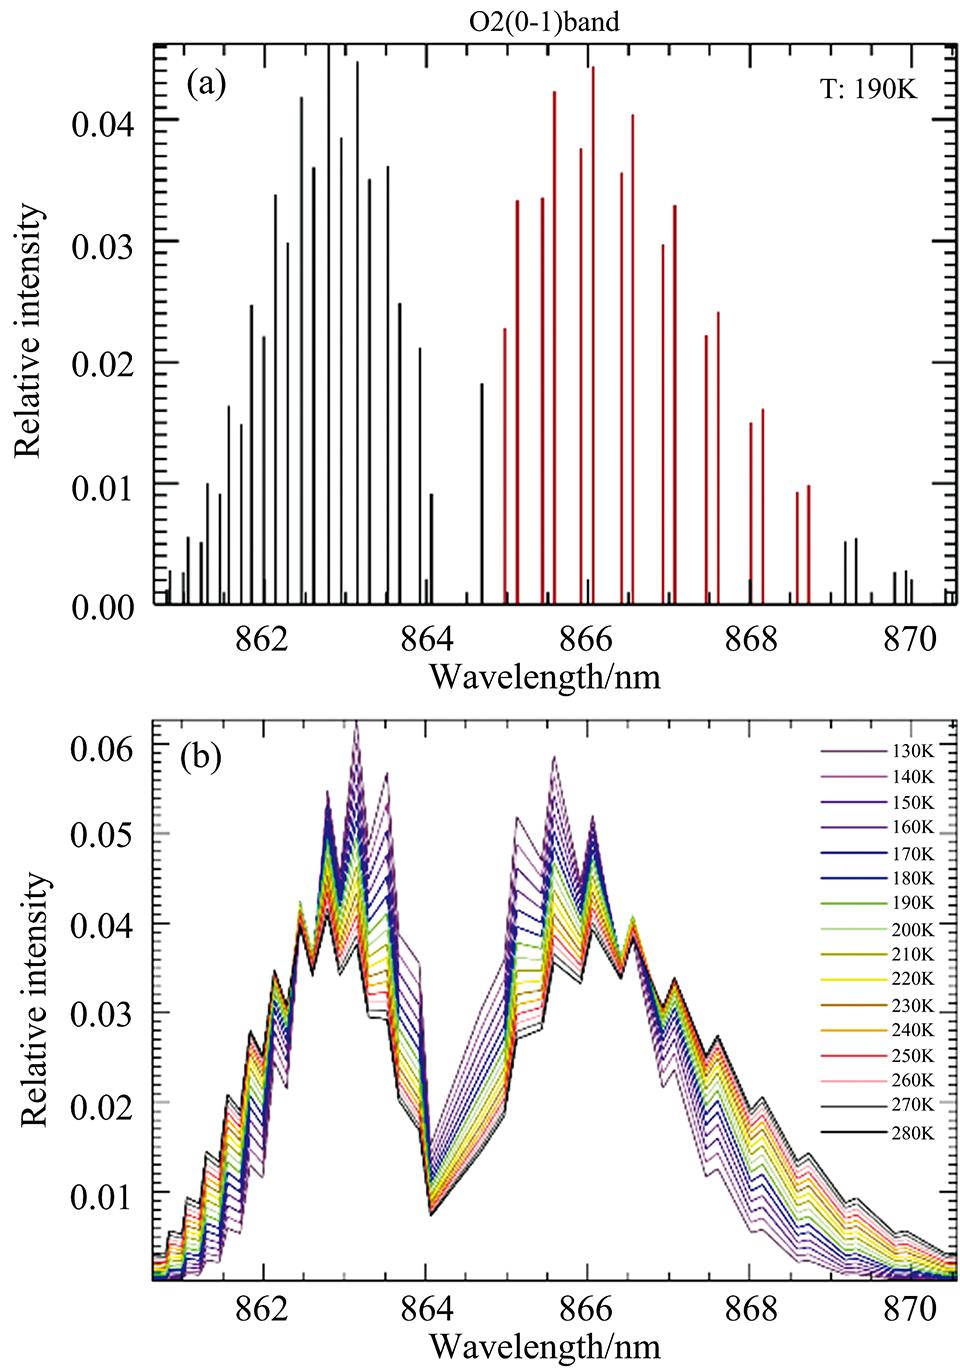
Fig. 1. (a)Relative intensity of O2(0-1)band emission; (b)Relative intensity change curves of O2 (0-1) band emission at rotational temperature changing with a step of 10 K

Fig. 2. Optical path design and physical chart of MASP instrument
Fig. 3. Schematic diagram of the MASP forward model
Fig. 4. Flat field calibration for MASP optical system
(a): Original calibrated image; (b): Flat field coefficient from center to the edge of image
(a): Original calibrated image; (b): Flat field coefficient from center to the edge of image
Fig. 5. Simulation images from forward model
(a): Simulation image of pure signal value at 220 K; (b): Simulation image by adding noise and coupling parameters of optical system at 220 K
(a): Simulation image of pure signal value at 220 K; (b): Simulation image by adding noise and coupling parameters of optical system at 220 K
Fig. 6. Synthetic spectra of forward model
(a): Absolute intensity of synthetic spectrum; (b): Relative intensity change curves of synthetic spectrum at the rotational temperature changing with a step of 10 K
(a): Absolute intensity of synthetic spectrum; (b): Relative intensity change curves of synthetic spectrum at the rotational temperature changing with a step of 10 K
Fig. 7. The process for removing background scattered signal of continuous spectrum
(a): Original synthetic spectrum; (b): Comparison of the results by removing background scattered signal with and without flat-field coefficient; (c): The distribution of difference between two methods
(a): Original synthetic spectrum; (b): Comparison of the results by removing background scattered signal with and without flat-field coefficient; (c): The distribution of difference between two methods
Fig. 8. Flow chart of temperature inversion for MASP
Fig. 9. Temperature inversion results for MASP
(a): Two observation cases on Oct. 12 and Nov. 1, 2018;(b): Comparison of the mean observation result during Oct. 2018 with the result of MSISE-00 empirical model
(a): Two observation cases on Oct. 12 and Nov. 1, 2018;(b): Comparison of the mean observation result during Oct. 2018 with the result of MSISE-00 empirical model
|
Table 1. Important parameters of MASP


Set citation alerts for the article
Please enter your email address

© Copyright 2018-2021 | Chinese Laser Press. All Rights Reserved 沪ICP备15018463号-20