• Acta Optica Sinica
  • Vol. 43, Issue 19, 1922001 (2023)
Lei Zhang1,2, Bo Li1,*, Guochao Gu1, Xiaoxu Wang1, and Hanshuang Li1
Author Affiliations
  • 1Changchun Institute of Optics, Fine Mechanics and Physics, Chinese Academy of Sciences, Changchun 130033, Jilin , China
  • 2University of Chinese Academy of Sciences, Beijing 100049, China
  • show less
    DOI: 10.3788/AOS230614 Cite this Article Set citation alerts
    Lei Zhang, Bo Li, Guochao Gu, Xiaoxu Wang, Hanshuang Li. Miniaturized Hyperspectral Resolution Imaging Spectrometer of AOTF and Echelle Grating Combination[J]. Acta Optica Sinica, 2023, 43(19): 1922001 Copy Citation Text show less
    Schematic of AOTF
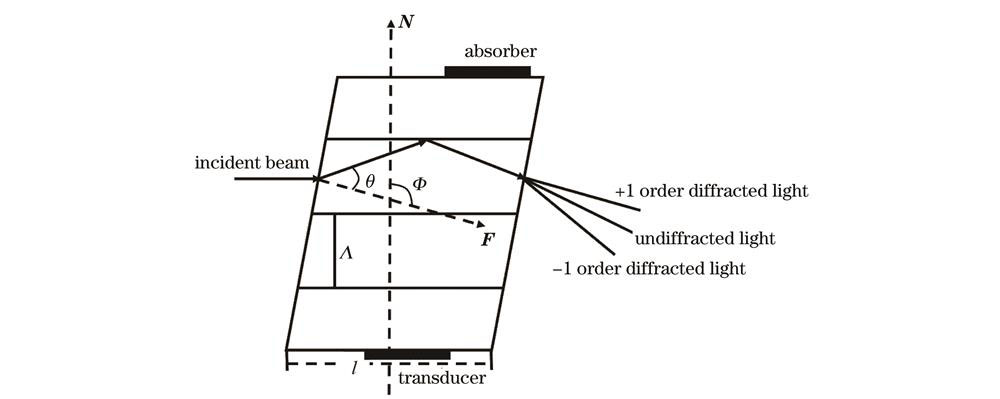
    Fig. 1. Schematic of AOTF
    Main interface of echelle grating
    Fig. 2. Main interface of echelle grating
    Structure of the telescopic imaging system. (a) Two-dimensional view; (b) three-dimensional view
    Fig. 3. Structure of the telescopic imaging system. (a) Two-dimensional view; (b) three-dimensional view
    MTF curves of telescopic system of each band. (a) 2320 nm; (b) 3285 nm; (c) 4250 nm
    Fig. 4. MTF curves of telescopic system of each band. (a) 2320 nm; (b) 3285 nm; (c) 4250 nm
    RMS point diagrams of telescopic system of each band. (a) 2320 nm; (b) 3285 nm; (c) 4250 nm
    Fig. 5. RMS point diagrams of telescopic system of each band. (a) 2320 nm; (b) 3285 nm; (c) 4250 nm
    Structure of echelle spectrograph
    Fig. 6. Structure of echelle spectrograph
    MTF curves of echelle spectrograph of each band. (a) 2320 nm; (b) 3285 nm; (c) 4250 nm
    Fig. 7. MTF curves of echelle spectrograph of each band. (a) 2320 nm; (b) 3285 nm; (c) 4250 nm
    RMS point diagrams of echelle spectrograph of each band. (a) 2320 nm; (b) 3285 nm; (c) 4250 nm
    Fig. 8. RMS point diagrams of echelle spectrograph of each band. (a) 2320 nm; (b) 3285 nm; (c) 4250 nm
    Overall structure of imaging spectrometer
    Fig. 9. Overall structure of imaging spectrometer
    MTF curves of overall structure of each band. (a) 2320 nm; (b) 3285 nm; (c) 4250 nm
    Fig. 10. MTF curves of overall structure of each band. (a) 2320 nm; (b) 3285 nm; (c) 4250 nm
    RMS point diagrams of overall structure of each band. (a) 2320 nm; (b) 3285 nm; (c) 4250 nm
    Fig. 11. RMS point diagrams of overall structure of each band. (a) 2320 nm; (b) 3285 nm; (c) 4250 nm
    ParameterValue
    Height /km400
    Wavelength range /nm2320-4250
    Spectral resolution /nm≤0.15
    Ground resolution /m100
    Entrance pupil /mm20
    Field /(°)1.1
    F<1.8
    MTF>0.7(@18 lp/mm)
    RMS radius /μm<11
    Nyquist frequency /(lp·mm-117
    Table 1. Main technical indices of designed spectrometer
    ParameterValue
    Wavelength range /nm2200-4400
    Optical aperture /(mm×mm)10×10
    Spectral resolution /nm6-23
    Peak diffraction efficiency /%>40
    RF power /W~5.0
    MaterialTeO2
    Table 2. Parameters of the AOTF
    ParameterValue
    X decentration /mm6.62
    Y decentration /mm-27.23
    Tilt /(°)-5.17
    2nd order coefficient-1.03
    4th order coefficient3.061×10-10
    6th order coefficient3.96×10-14
    Table 3. Surface parameters of aspheric mirror
    Wavelength range /nmNumber of orders
    2320-270091
    2701-300081
    3001-325071
    3251-355065
    3551-375060
    3751-400055
    4001-425051
    Table 4. Number of orders of echelle grating
    Lei Zhang, Bo Li, Guochao Gu, Xiaoxu Wang, Hanshuang Li. Miniaturized Hyperspectral Resolution Imaging Spectrometer of AOTF and Echelle Grating Combination[J]. Acta Optica Sinica, 2023, 43(19): 1922001
    Download Citation