
Lili JIANG, Shuaishuai XU, Baokai XIA, Sheng CHEN, Junwu ZHU. Defect Engineering of Graphene Hybrid Catalysts for Oxygen Reduction Reactions [J]. Journal of Inorganic Materials, 2022, 37(2): 215
- Journal of Inorganic Materials
- Vol. 37, Issue 2, 215 (2022)
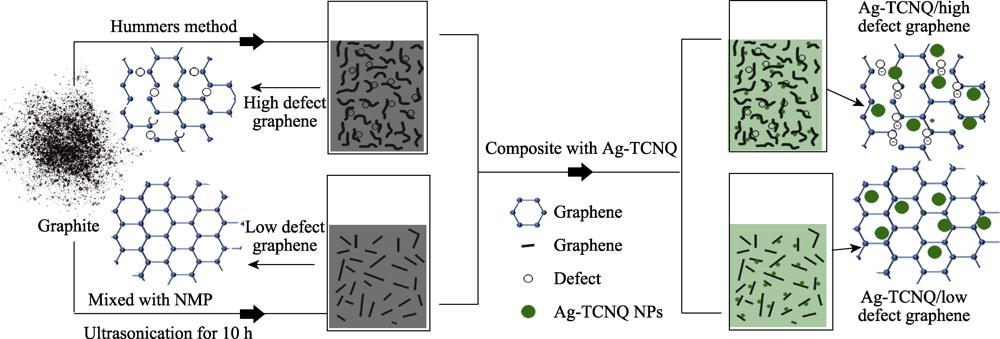
1. Schematic diagram of material preparation process
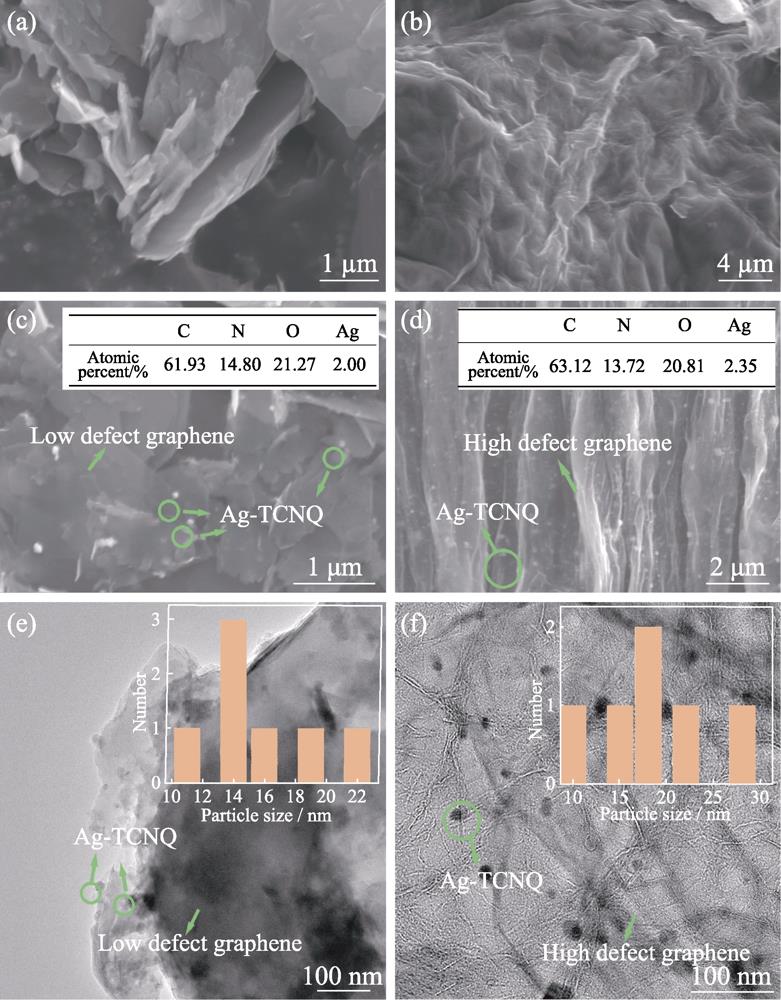
2. SEM images of (a) low defect graphene, (b) high defect graphene, (c) Ag-TCNQ/low defect graphene, and (d) Ag- TCNQ/ high defect graphene with insets in (c, d) showing corresponding element analyses, TEM images and size distributions of (e) Ag- TCNQ/low defect graphene and (f) Ag-TCNQ/high defect graphene
3. XRD patterns of (a) high defect graphene, Ag-TCNQ/high defect graphene, (b) low defect graphene and Ag-TCNQ/ low defect graphene with inset in (b) showing enlarged XRD profiles of Ag-TCNQ, Ag-TCNQ/high defect graphene and Ag-TCNQ low defect graphene; Raman spectra of (c) Ag- TCNQ/low defect graphene, Ag-TCNQ/high defect graphene, and (d) low defect graphene and high defect graphene
4. (a) CV curves of Ag-TCNQ/high defect graphene and Ag-TCNQ/low defect graphene; (b) LSV curves of Pt/C, Ag-TCNQ, low defect graphene, high defect graphene, Ag-TCNQ/low defect graphene and Ag-TCNQ/high defect graphene on RRDE at 1600 r/min; LSV curves of (c) Ag-TCNQ/low defect graphene and (d) Ag-TCNQ/high defect graphene on RRDE at different rotating speeds in RRDE; K-L curves and electron transfer numbers calculated by K-L method of (e) Ag-TCNQ/low defect graphene and (f) Ag-TCNQ/high defect graphene
5. I -t curves of (a) Ag-TCNQ/high defect graphene and (b) Ag-TCNQ/low defect graphene with insets showing corresponding LSV curves before and after test, (c) standard line of hydrogen peroxide concentration and UV-Vis absorbance, and (d) production rates of Ag-TCNQ/high defect graphene and Ag-TCNQ/ low defect graphene at different potentials
6. (a,c) CV curves (0.87-1.06 V (vs. RHE)) at different scan rates and (b, d) corresponding capacitive Δj /2 at 0.98 V (vs. RHE) as a function of the scan rate for (a,b) Ag-TCNQ/high defect graphene and (c,d) Ag-TCNQ/low defect graphene
7. Schematic diagram of ORR on the surfaces of Ag- TCNQ/high defect graphene (left) and Ag-TCNQ/low defect graphene (right)


Set citation alerts for the article
Please enter your email address

© Copyright 2018-2021 | Chinese Laser Press. All Rights Reserved 沪ICP备15018463号-20