
Ruanzhao Guo, Ke Wang, Huiqin Wang, Zhan Wang, Gang Zhen, Yuan Li, Jiachen Li. Anti-Disturbance Cross-Scene Multispectral Imaging Pigment Classification Method for Painted Cultural Relics[J]. Laser & Optoelectronics Progress, 2024, 61(18): 1812004
- Laser & Optoelectronics Progress
- Vol. 61, Issue 18, 1812004 (2024)
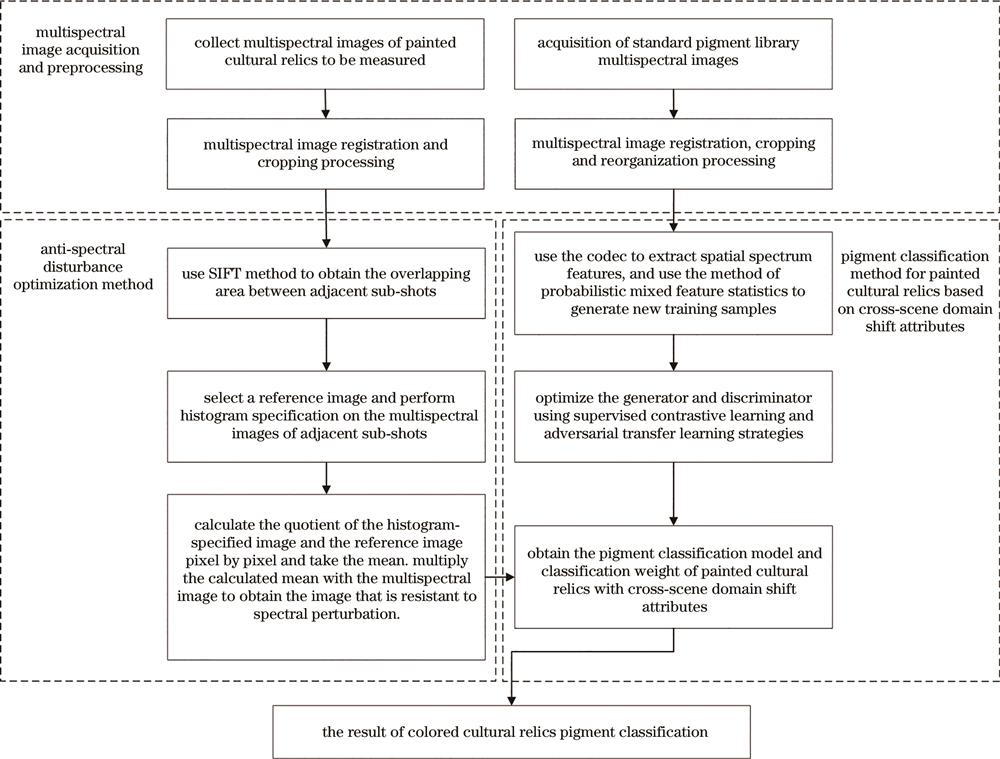
Fig. 1. Schematic diagram of the process for anti-disturbance cross-scene multispectral imaging for classification of pigments in painted cultural relics

Fig. 2. Spectral image of the mural in the 660 nm channel
Fig. 3. Flowchart of anti-spectral disturbance
Fig. 4. Schematic diagram of the overlapping region of two shots. (a) Sketch of the mural sub-lens shooting; (b) multispectral images of overlapping region of sub-lens; (c) spectral image and grayscale histogram of 660 nm overlapping region
Fig. 5. Basic image and histogram specification images. (a) Basic image
Fig. 6. Anti-spectral perturbation results. (a) Basic imag
Fig. 7. Painted cultural relic pigment classification network structure with cross-scene domain shift attributes
Fig. 8. Diagram of encoder
Fig. 9. Structure diagram of feature extractor
Fig. 10. Flowchart of classification and identification of pigments in painted cultural relics
Fig. 11. Schematic diagram of multispectral imaging system
Fig. 12. Experimental data of anti-spectral perturbation by sub-shot. (a) Schematic diagram of shot shooting of simulated murals; (b) shot 1 captures multispectral images at 620 nm; (c) shot 2 captures multispectral images at 620 nm; (d) multispectral images before resisting spectral perturbation at 620 nm; (e) multispectral images after resisting spectral perturbation at 620 nm
Fig. 13. Ground truth and marking diagram of simulated mural. (a) Ground truth of simulated mural; (b) marking diagram of simulated mural
Fig. 14. OA and Kappa coefficients of each algorithm before and after anti-spectral disturbance
Fig. 15. Images of simulated pigment plate and simulated mural at 620 nm. (a) Multispectral image of pigment plate at 620 nm; (b) interest marker image of pigment board points; (c) simulation mural of single exposure shot at 620 nm
Fig. 16. Generalization ability experiment. (a) Generated data distribution; (b) data distribution after processing by the discriminator
Fig. 17. Results of cross-scene classification between paint panels and simulated murals. (a) Ground truth; (b) DHCNet[23]; (c) FDSSC[24]; (d) SSRN[25]; (e) SSKR[26]; (f) HPDM-SPRN[27]; (g) BASSNet[28]; (h) DFFN[29]; (i) proposed method
Fig. 18. Schematic diagram of the scene shooting of the Mingwang statue in Dule Temple
Fig. 19. Colored and labeled images of mural. (a) Mural color image; (b) shot 1 training samples
Fig. 20. Classification effect of different methods on murals. (a) Proposed method; (b) DHCNet[23]; (c) FDSSC[24]; (d) SSRN[25]; (e) SSKR[26]; (f) HPDM-SPRN[27]; (g) BASSNet[28]; (h) DFFN[29]; (i) SVM
Fig. 21. Schematic diagram of XRF test points and multispectral images of the Thirteenth Venerable
Fig. 22. XRF analysis results of the Thirteenth Venerable. (a) XRF analysis result of point 1; (b) XRF analysis result of point 2; (c) XRF analysis result of point 3; (d) XRF analysis result of point 4
Fig. 23. Pigment multispectral image training set
Fig. 24. Diagram of the pigment distribution of the Thirteenth Holiness
|
Table 1. Simulated mural multi-spectral image sample
|
Table 2. Classification results of different methods before and after anti-spectral perturbation
| |||||||||||||||||||||||||||||||||||||||||||||||||||||||||||||||||||||||||||||||||||||||||
Table 3. Classification accuracy of different methods before and after anti-spectral disturbance
| |||||||||||||||||||||||||||||||||||||||||||||||||||||||||||||||||||||
Table 4. Quality objective evaluation results of image
|
Table 5. Samples of simulated mural multispectral images
|
Table 6. Classification accuracy of different methods on pigment cross-scene
|
Table 7. Results of objective evaluation of image quality cross-scene
|
Table 8. Ablation experiments of different modules


Set citation alerts for the article
Please enter your email address

© Copyright 2018-2021 | Chinese Laser Press. All Rights Reserved 沪ICP备15018463号-20