
Dingyi Ma, Xinyu Liu, Yongzheng Li, Linfeng Guo, Xiaomin Xu. Advances in Machine-Learning Techniques for Distributed Fiber-Optic Sensing Performance Enhancement[J]. Laser & Optoelectronics Progress, 2025, 62(3): 0300002
- Laser & Optoelectronics Progress
- Vol. 62, Issue 3, 0300002 (2025)
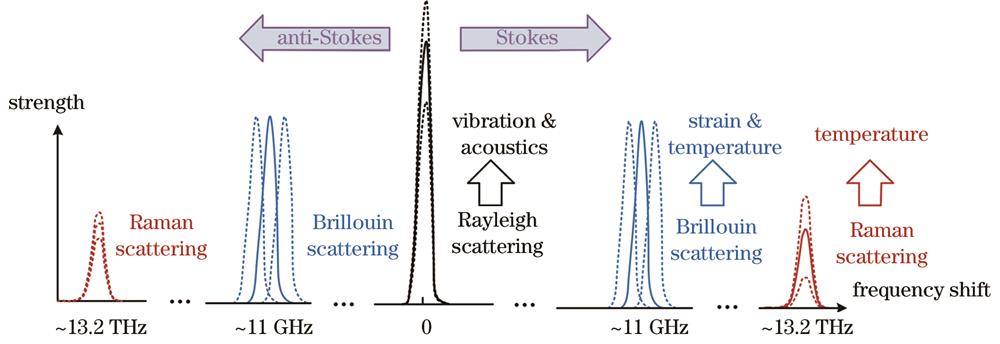
Fig. 1. Light scattering components in optical fibers
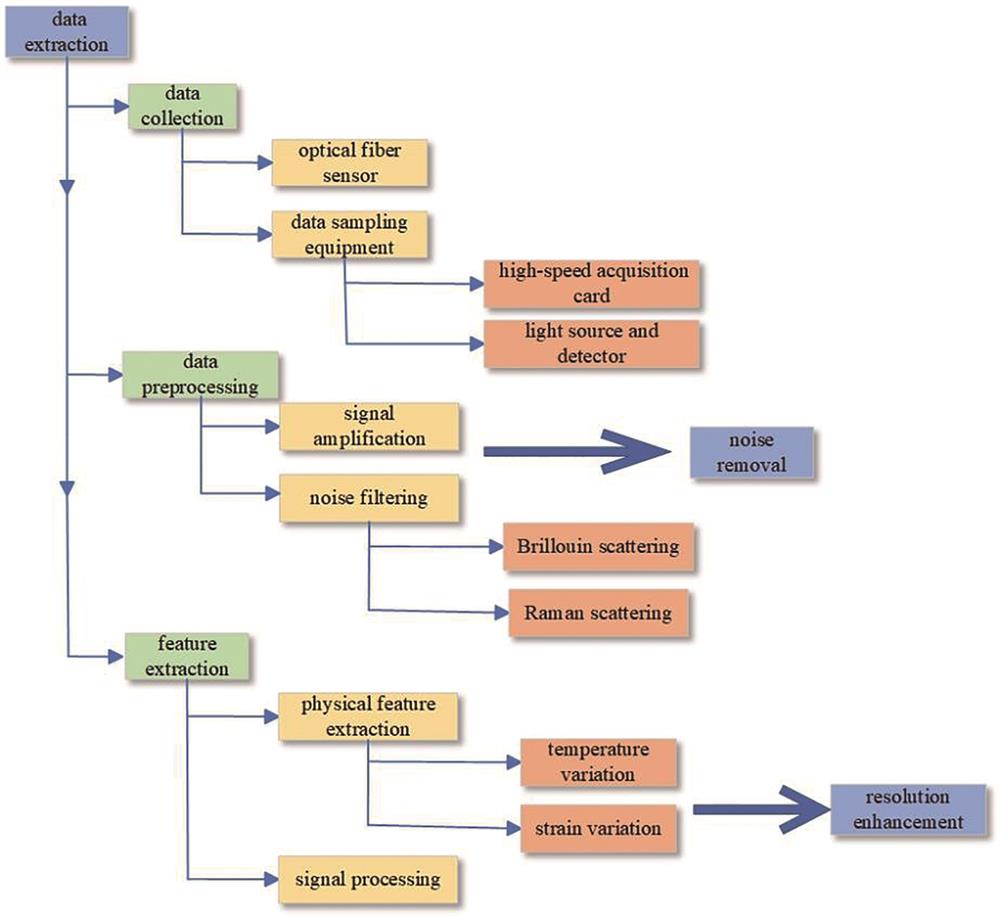
Fig. 2. Technical lineage of machine learning techniques for data extraction, noise removal, and resolution enhancement
Fig. 3. Basic principle of fiber optic sensing system
Fig. 4. Schematic of distributed fiber optic sensing for infrastructure monitoring[22]
Fig. 5. Schematic of ANN[24]
Fig. 6. Functional block diagram for extracting temperature from BGS measured by BOTDA based on PCA pattern recognition[31]
Fig. 7. Principle of temperature extraction using linear multi-class SVM classifier[33]
Fig. 8. Schematic of two-step signal processing for measuring BGSs[39]
Fig. 9. B-ANN and NLE-ANN training flowcharts[40]. (a) Standard BGS as B-ANN training dataset; (b) non-local BGS as NLE-ANN training dataset
Fig. 10. Schematic of FNN training process[41]
Fig. 11. Principle of using DNN for simultaneous temperature and strain measurement from double-peak BGS in LEAF[42]
Fig. 12. Architecture of proposed BFSCNN[43]
Fig. 13. Structure of DNN with one autoencoder (left side shows BGS trace of whole FUT and right side shows temperature distribution obtained from LFC and DNN)[50]
Fig. 14. Training process of the DnCNN[52]
Fig. 15. Diagram of basic architecture of FastDVDnet[54]
Fig. 16. Flowchart of steps involved in updating the denoiser R, generator G, and discriminator D (θ refers to the entire training model, and ncritic represents the required number of iterations)[55]
Fig. 17. Principle of SAID method for BOTDR[57]
Fig. 18. Diagram of algorithm and beat spectrum histograms expected to be obtained[61]
Fig. 19. Neural network structure diagram[62]. (a) Overall architecture of neural networks; (b) middle block structure of plain CNN; (c) middle block structure of ResNet; (d) middle block structure of SSRNet
Fig. 20. Training process of three classifiers[69]
Fig. 21. Optimized network structure (red cube denotes convolution operation and blue cube denotes pooling operation)[70]
Fig. 22. Action recognizer model[71]
|
Table 1. Performance parameter comparison among different methods
|
Table 2. Performance comparison of different denoising methods


Set citation alerts for the article
Please enter your email address

© Copyright 2018-2021 | Chinese Laser Press. All Rights Reserved 沪ICP备15018463号-20