
Zhiqiang Liu, Hao Liu, Lühan Xu, Mao Ye. A Dynamic Foveated Optical Imaging System[J]. Acta Optica Sinica, 2023, 43(19): 1911001
- Acta Optica Sinica
- Vol. 43, Issue 19, 1911001 (2023)
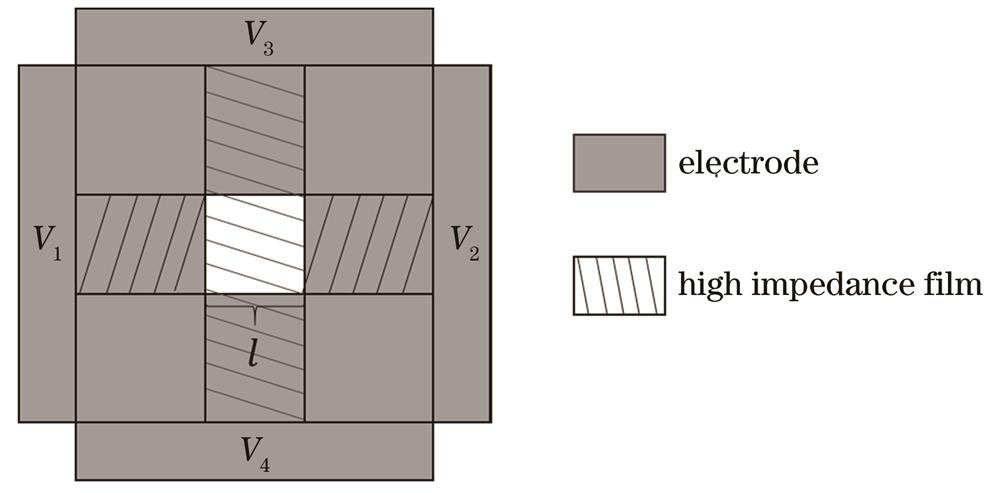
Fig. 1. Structural drawing of square hole lens

Fig. 2. Electric field simulation result diagrams. (a) The center coordinate is (0,1); (b) the center coordinate is (0,-1); (c) the center coordinate is (-1,0); (d) the center coordinate is (1,0)
Fig. 3. Interference fringe of liquid crystal lens. (a)-(d) The center coordinates of the liquid crystal lenses are (0,1), (0,-1), (-1,0), (1,0)
Fig. 4. Response curve of liquid crystal with voltage
Fig. 5. Wavefront diagram of liquid crystal lens with different centers
Fig. 6. Schematic diagram of the dynamic foveated imaging experimental device
Fig. 7. Dynamic imaging foveated experimental device diagram
Fig. 8. Schematic diagram of liquid crystal lens scanning and area of interest
Fig. 9. Results of the dynamic foveated imaging experiment. (a)-(d) The small foveated images corresponding to the center coordinates of the liquid crystal lens (0,1), (0,-1), (-1,0), and (1,0)
Fig. 10. MTF curves of the region of interest and the low-resolution region of the dynamic foveated imaging system
| |||||||||||||||||||||||||||||||||||||||||||||||||
Table 1. Parameter table of moving position of different electric field centers


Set citation alerts for the article
Please enter your email address

© Copyright 2018-2021 | Chinese Laser Press. All Rights Reserved 沪ICP备15018463号-20