
Zhikai Zhu, Fenglin Chen, Feilong Liang, Wenqing Shi, Yang Zhao, Jiang Huang. Study on Laser Cladding Performance Improvement of AlCoCrFeNi-TiC5/WC15 Coating by Adding CeO2[J]. Laser & Optoelectronics Progress, 2025, 62(3): 0314008
- Laser & Optoelectronics Progress
- Vol. 62, Issue 3, 0314008 (2025)
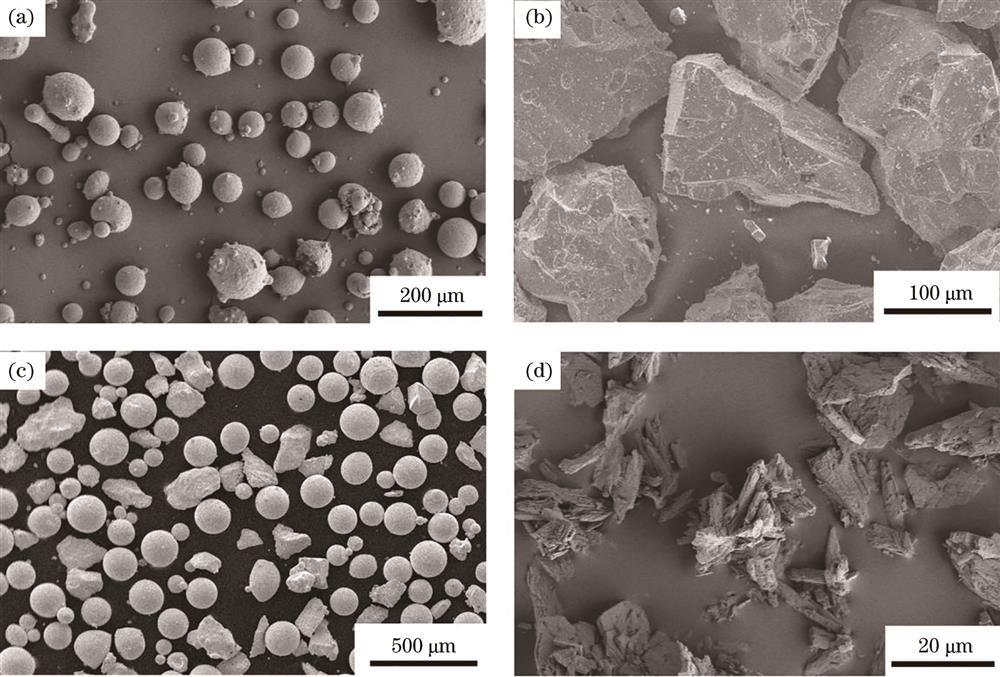
Fig. 1. SEM morphology of powder. (a) High-entropy alloy AlCoCrFeNi powder; (b) TiC powder; (c) WC powder; (d) CeO2 powder

Fig. 2. XL-F2000W fiber laser processing system
Fig. 3. Full cross-section of cladding with different CeO2 content. (a) 0%CeO2; (b) 1%CeO2; (c) 2%CeO2; (d) 3%CeO2
Fig. 4. SEM images of cladding layers with different content of CeO2. (a) 0% bottom of cladding layer; (b) 0% middle of cladding layer; (c) 0% cladding top; (d) bottom of 1% cladding layer; (e) middle of 1% cladding layer; (f) top of 1% cladding layer; (g) bottom of 2% cladding layer; (h) middle of 2% cladding layer; (i) top of 2% cladding layer; (j) bottom of 3% cladding layer; (k) middle of 3% cladding layer; (l) top of 3% cladding layer
Fig. 5. SEM and enlarged images of cladding layers with 2% CeO2 content added. (a) Bottom of 2% cladding layer; (b) middle part of 2% cladding layer; (c) top of 2% cladding layer; (d) enlargement view of bottom of 2% cladding layer; (e) enlargement of middle of 2% cladding layer; (f) enlargement of top of 2% cladding layer
Fig. 6. SEM image and EDS surface scanning of cladding layer with 2% CeO2 are added
Fig. 7. XRD pattern and magnification of micro CeO2 cladding layer. (a) XRD pattern; (b) XRD magnification
Fig. 8. Microhardness diagram and average hardness distribution histogram of cladding layer after adding 0%‒3%CeO2. (a) Microhardness diagram; (b) distribution diagram of average hardness
Fig. 9. Curves of friction coefficient of cladding layer with time
Fig. 10. Curves of wear variation with scanning distance
Fig. 11. Potentiodynamic polarization curves of cladding layer in 3.5% NaCl solution
Fig. 12. Nyquist impedance diagram of cladding layer in 3.5% NaCl solution
Fig. 13. Potentiodynamic polarization curve of cladding layer in 1 mol/L NaOH solution
Fig. 14. Nyquist impedance diagram of cladding layer in 1 mol/L NaOH solution
Fig. 15. Potentiodynamic polarization curve of cladding layer in 1 mol/L H2SO4 solution
Fig. 16. Nyquist impedance diagram of cladding layer in 1 mol/L H2SO4 solution
|
Table 1. Chemical composition of 316L stainless steel
|
Table 2. Chemical composition of high-entropy alloy AlCoCrFeNi
|
Table 3. Wear amount of cladding layer with different CeO2 content
|
Table 4. Self-corrosion voltage and current density of cladding layers with different CeO2 content in 3.5% NaCl solution
|
Table 5. Self-corrosion voltage and corrosion current density of cladding layer with different CeO2 content in 1 mol/L NaOH solution
|
Table 6. Self-corrosion voltage and corrosion current density of cladding layer with different CeO2 content in 1 mol/L H2SO4 solution


Set citation alerts for the article
Please enter your email address

© Copyright 2018-2021 | Chinese Laser Press. All Rights Reserved 沪ICP备15018463号-20