• Infrared and Laser Engineering
  • Vol. 52, Issue 7, 20220875 (2023)
Qingge Li, Xiaogang Yang, Ruitao Lu, Siyu Wang..., Jiwei Fan and Hai Xia|Show fewer author(s)
Author Affiliations
  • Missile Engineering Institute, PLA Rocket Force University of Engineering, Xi'an 710025, China
  • show less
    DOI: 10.3788/IRLA20220875 Cite this Article
    Qingge Li, Xiaogang Yang, Ruitao Lu, Siyu Wang, Jiwei Fan, Hai Xia. Cross-modal geo-localization method based on GCI-CycleGAN style translation[J]. Infrared and Laser Engineering, 2023, 52(7): 20220875 Copy Citation Text show less
    Framework of the cross-modal geo-localization method
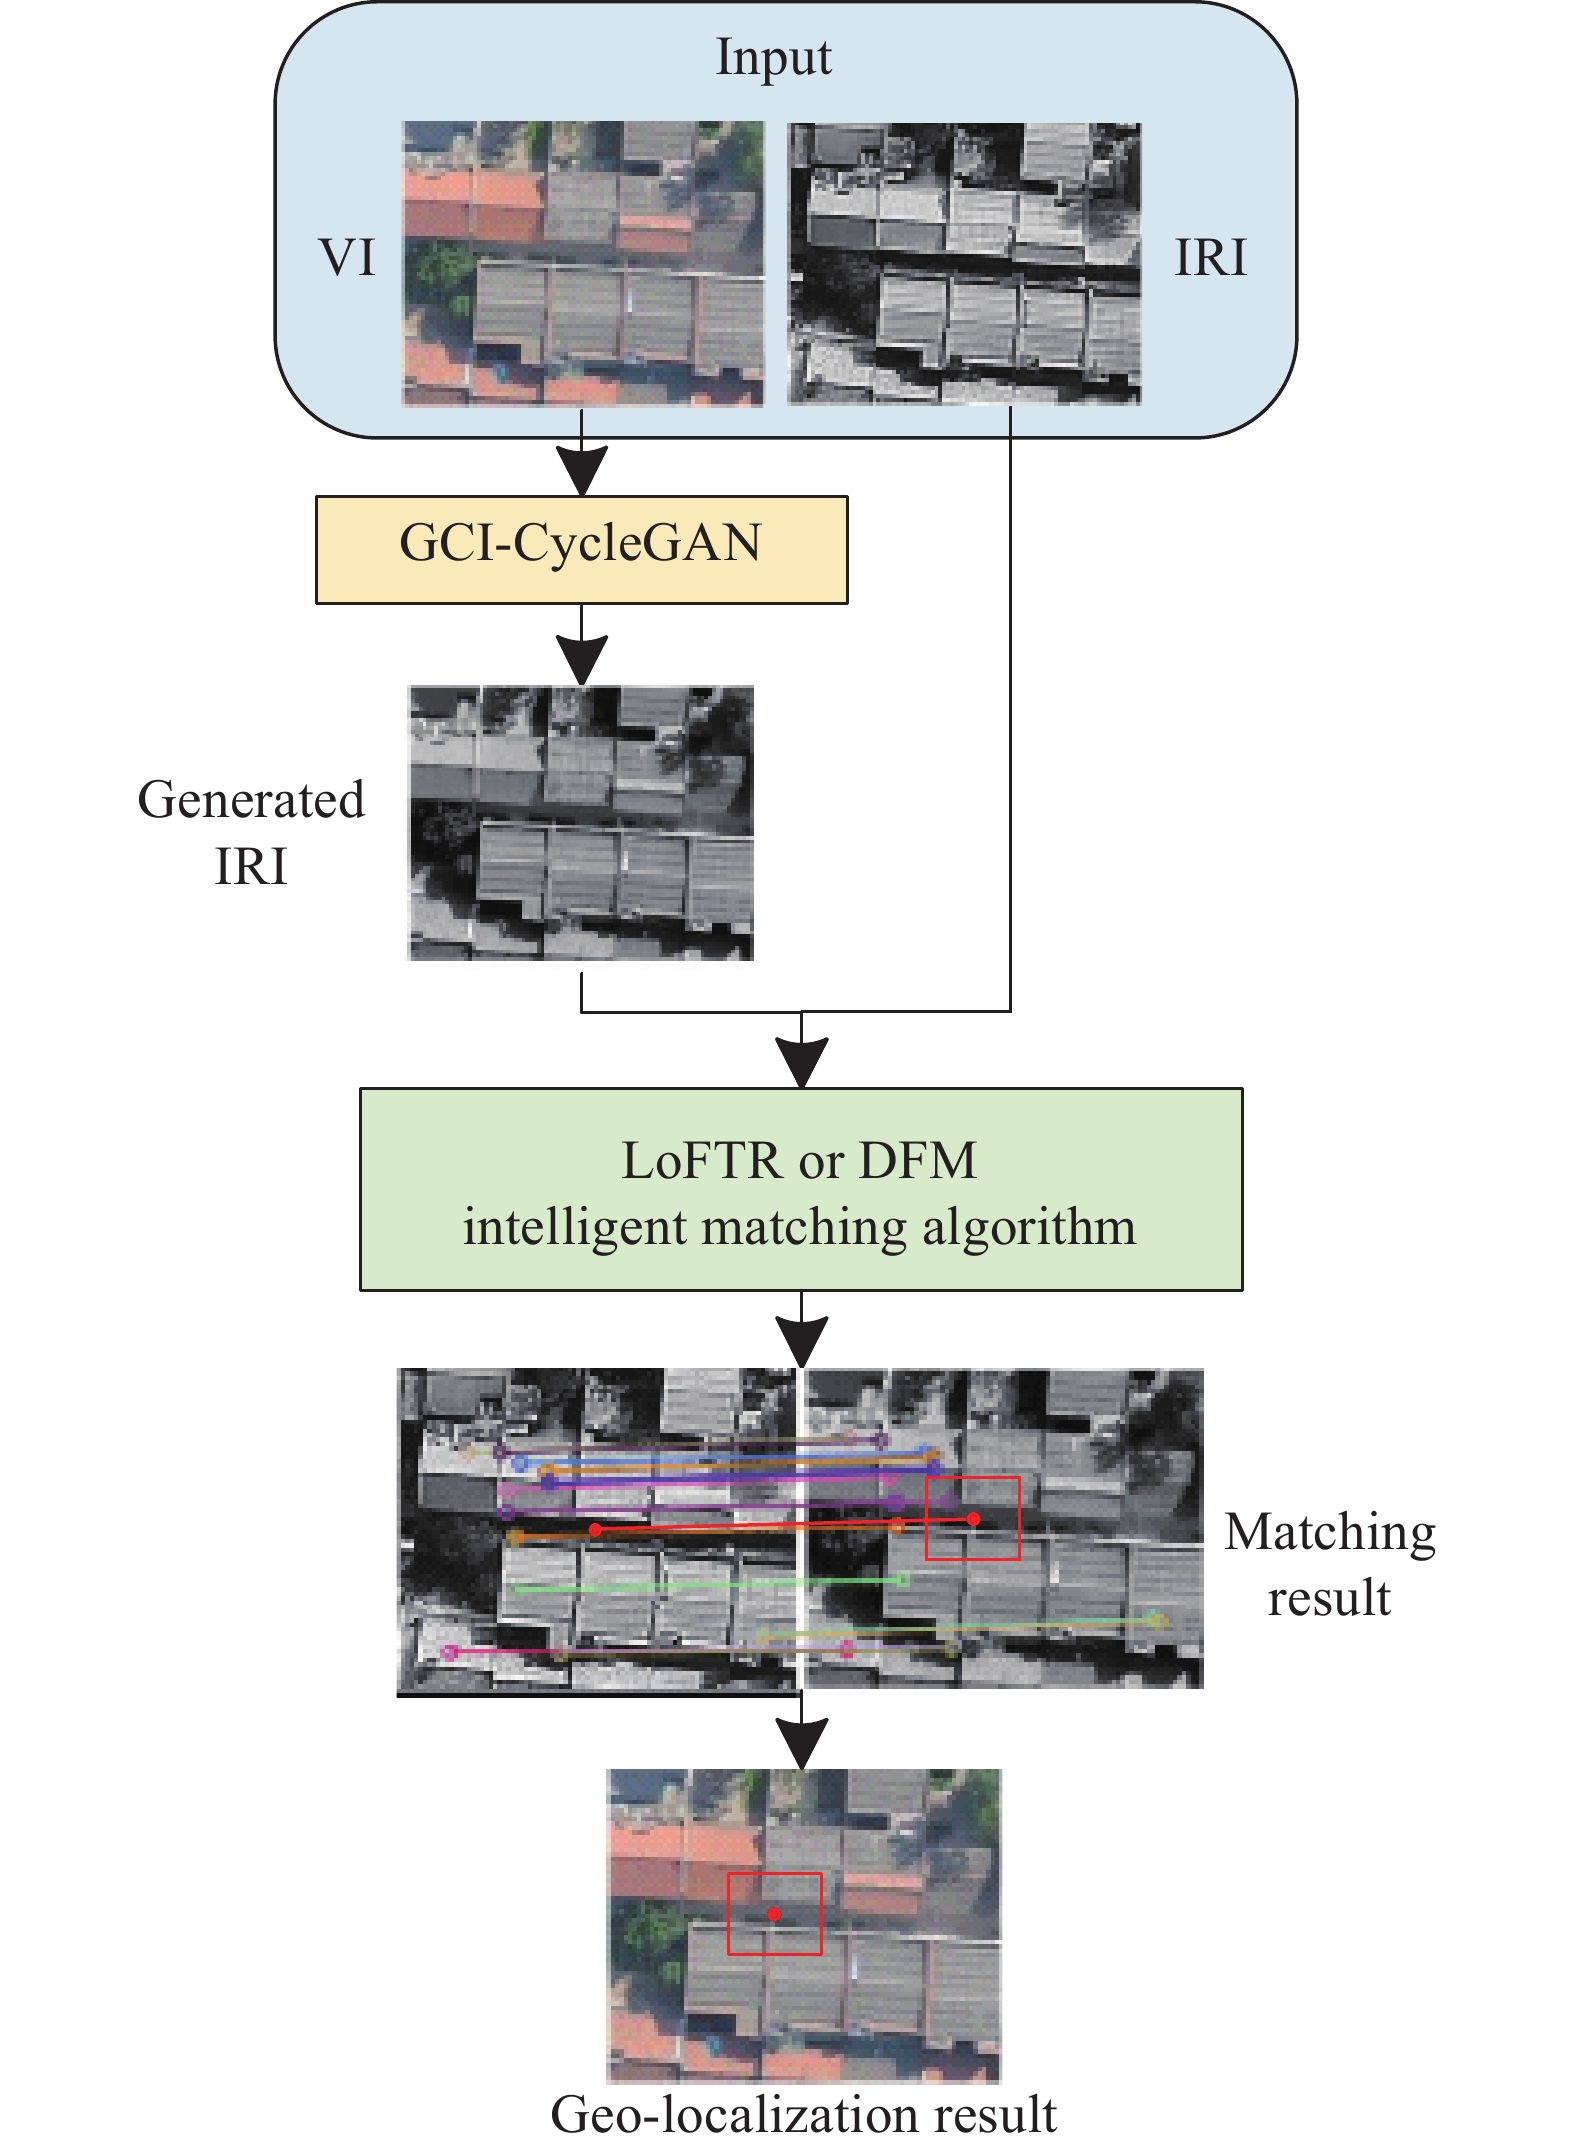
    Fig. 1. Framework of the cross-modal geo-localization method
    Principle of the cross-modal images style translation
    Fig. 2. Principle of the cross-modal images style translation
    Diagram of the GCI-CycleGAN model structure
    Fig. 3. Diagram of the GCI-CycleGAN model structure
    Example of training samples. (a) VIs; (b) IRIs
    Fig. 4. Example of training samples. (a) VIs; (b) IRIs
    Loss function curve. (a) CycleGAN; (b) GCI-CycleGAN
    Fig. 5. Loss function curve. (a) CycleGAN; (b) GCI-CycleGAN
    Diagram of the LoFTR model structure
    Fig. 6. Diagram of the LoFTR model structure
    Diagram of the DFM model structure
    Fig. 7. Diagram of the DFM model structure
    (a) VIs to be converted; (b) IRIs converted by CycleGAN; (c) IRIs converted by GCI-CycleGAN; (d) Real IRIs
    Fig. 8. (a) VIs to be converted; (b) IRIs converted by CycleGAN; (c) IRIs converted by GCI-CycleGAN; (d) Real IRIs
    Comparison of the matching methods results
    Fig. 9. Comparison of the matching methods results
    Example images of the geo-location dataset. (a) Visible images; (b) Real-time infrared images; (c) Generated infrared images
    Fig. 10. Example images of the geo-location dataset. (a) Visible images; (b) Real-time infrared images; (c) Generated infrared images
    Diagram of the matching and geo-location results
    Fig. 11. Diagram of the matching and geo-location results
    Comparison between actual flight trajectory and location results
    Fig. 12. Comparison between actual flight trajectory and location results
    PSNR/dBaHashpHashLPIPS
    Original images14.77112.40010.2000.342
    CycleGAN19.17611.20010.0000.208
    GCI-CycleGAN19.42210.4009.8000.191
    Table 1. Performance comparison of different models
    MethodsDataset${p_A}$${p_B}$CMPMSRFPS/frame·s−1
    SIFT+GMSTS1353336246.97%25
    TS23521812910.88%2.33
    TS33533596317.70%2.38
    SURF+GMSTS13503503810.86%3.03
    TS23503336218.16%1.39
    TS33503578824.89%1.63
    ORB+GMSTS14664535812.62%3.23
    TS246645315934.60%1.45
    TS346645525755.81%1.43
    LoFTRTS138538530178.18%2.33
    TS243743741194.05%1.23
    TS344244243297.74%1.25
    DFMTS130530528994.75%1.52
    TS243443442898.62%0.95
    TS358158157899.48% 0.96
    Table 2. Performance comparison of matching methods
    GroupTrue locationSIFTSURFORBLoFTRDFM
    Positioning coordinates 1(52, 43)(43, 42)(40, 39)(50, 34)(51, 42)(52, 44)
    2(46, 36)(54, 45)(47, 42)(45, 33)(48, 36)(45, 37)
    3(54, 38)(51, 37)(48, 32)(48, 35)(52, 39)(54, 40)
    4(48, 40)(50, 43)(48, 45)(51, 48)(48, 38)(49, 40)
    5(48, 34)(42, 35)(40, 38)(42, 37)(46, 35)(48, 35)
    6(46, 38)(50, 40)(47, 43)(52, 41)(46, 39)(47, 39)
    Average errors/pixel-6.528.306.841.811.37
    Table 3. The performance of geo-location
    Qingge Li, Xiaogang Yang, Ruitao Lu, Siyu Wang, Jiwei Fan, Hai Xia. Cross-modal geo-localization method based on GCI-CycleGAN style translation[J]. Infrared and Laser Engineering, 2023, 52(7): 20220875
    Download Citation