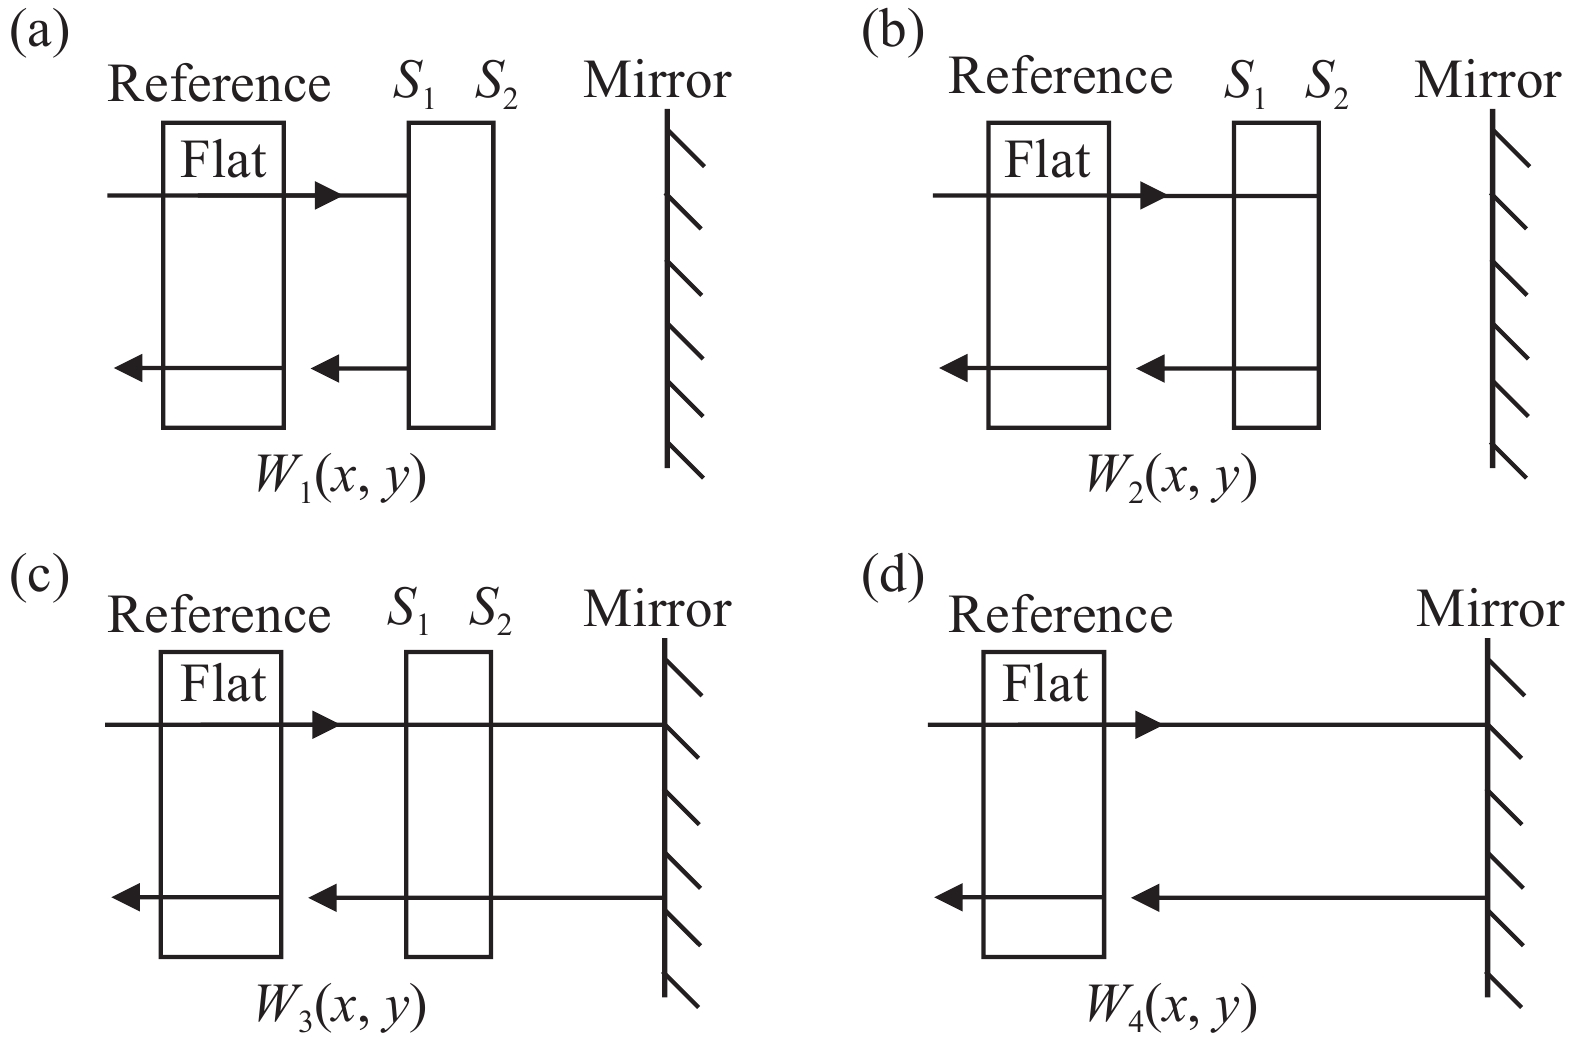
Fig. 1. (a) Reflected wavefront of sample’s front surface S1; (b) Reflected wavefront of sample’s back surface S2; (c) Transmitted wavefront of sample; (d) Cavity wavefront of test optical path
Fig. 2. Refractive index homogeneity of sample Si (a), sample ZnSe (b), sample Ge (c), sample ZnS (d)
Fig. 3. Model diagram of online device with lens alignment and image quality measurement
Fig. 4. Schematic diagram of iterative adjustment position
Fig. 5. Schematic diagram of aberration effect on system wavefront
Fig. 6. Schematic diagram of system wavefront compensation
Fig. 7. Schematic diagram of the relationship between wave aberration and incident angle
Fig. 8. Optical structure diagram of infrared lens
Fig. 9. (a) Structure of clamping device; (b) Connection mode between clamping device and lens barrel
| Element | Material | Thickness/mm | Aperture/mm | | Optical windows | CaF2 | 13.002 | 205 | | Lens1 | Si | 15.033 | 210 | | Lens2 | Si | 15.950 | 205 | | Lens3 | Ge | 13.081 | 160 | | Lens4 | Ge | 11.367 | 135 | | Lens5 | Si | 11.616 | 130 | | Lens6 | ZnSe | 9.612 | 120 |
|
Table 1. Some optical system parameters of infrared lens
| FOV | System wavefront
diagram & MTF
(λ=3.39 μm)
| Zernike coefficients of
main aberration terms
| | +6.5° | | First order: k5: −0.074;
k6: −0.055; k7: 0.202;
k8: 0.024; k9: 0.167.
Medium & high order:
k10: −0.044; k11: −0.027;
k12: 0.159; k14: 0.020;
k16: −0.133; k19: 0.091;
k20: 0.066; k30: −0.047.
| | 0° | | First order: k5: −0.030;
k6: −0.009;k7: −0.089;
k8: −0.037; k9: 0.149.
Medium & high order:
k10: −0.057; k11: −0.037;
k12: 0.095; k14: 0.030;
k16: −0.128; k19:0.111;
k20: 0.089; k30: −0.047.
| | −6.5° | | First order: k5: 0.050;
k6: −0.062; k7: −0.326;
k8: −0.041; k9: 0.127.
Medium & high order:
k10: −0.168; k11: −0.057;
k12: 0.084; k14: 0.058;
k16: −0.116; k19: 0.062;
k20: 0.084; k30: −0.046.
|
|
Table 2. Measurement results of lens image quality after precision centering
| FOV | System wavefront
diagram & MTF
(λ=3.39 μm)
| Zernike coefficients of
main aberration terms
| | +6.5° | | First order: k5: 0.010;
k6: 0.007; k7: 0.011;
k8: 0.023; k9: 0.029.
Medium & high order:
k10: 0.015; k11: −0.031;
k12: 0.133; k14: 0.032;
k16: −0.125; k19: 0.078;
k20: 0.073; k30: −0.050.
| | 0° | | First order: k5: −0.011;
k6: 0.009;k7: −0.032;
k8: 0.020; k9: 0.007.
Medium & high order:
k10: −0.069; k11: −0.058;
k12: 0.078; k14: 0.012;
k16: −0.118; k19:0.100;
k20: 0.084; k30: −0.044.
| | −6.5° | | First order: k5: 0.015;
k6: −0.013; k7: −0.015;
k8: 0.022; k9: 0.001.
Medium & high order:
k10: −0.155; k11: −0.046;
k12: 0.055; k14: 0.075;
k16: −0.118; k19: 0.090;
k20: 0.091; k30: −0.041.
|
|
Table 3. Measurement results of lens image quality after iterative adjustment position
| FOV | Transmission wavefront
(λ=3.39 μm)
| Zernike coefficients of medium &
high order aberration terms
| | 0° | | k10: 0.064; k11: 0.031;
k12: −0.080; k14: −0.044;
k16: 0.118; k19:- 0.099;
k20: −0.073; k30: 0.051.
|
|
Table 4. Transmission wavefront measurement result of the repaired optical windows
| FOV | System wavefront
diagram & MTF
(λ=3.39 μm)
| Zernike coefficients of
main aberration terms
| | +6.5° | | First order: k5: 0.011;
k6: 0.005; k7: 0.015;
k8: 0.019; k9: 0.017.
Medium & high order:
k10: 0.072; k11: 0.004;
k12: 0.087; k14: −0.007;
k16: −0.010; k19: −0.025;
k20: −0.015; k30: −0.007.
| | 0° | | First order: k5: −0.009;
k6: 0.014;k7: −0.021;
k8: 0.018; k9: 0.005.
Medium & high order:
k10: −0.007; k11: −0.023;
k12: −0.005; k14: −0.030;
k16: −0.006; k19:0.007;
k20: 0.009; k30: 0.004.
| | −6.5° | | First order: k5: 0.012;
k6: −0.015; k7: −0.017;
k8: 0.015; k9: 0.002.
Medium & high order:
k10: −0.095; k11: −0.019;
k12: −0.029; k14: 0.035;
k16: −0.007; k19: −0.007;
k20: 0.027; k30: 0.006.
|
|
Table 5. Measurement results of lens image quality after surface modification