Xinyue Cai1, Yang Zhou1,2,3,*, Xiaofei Hu1,2, Lü Liang1,2,3..., Luying Zhao1,4 and Yangzhao Peng1|Show fewer author(s)
Author Affiliations
1Institute of Geospatial Information, Information Engineer University, Zhengzhou 450001, Henan, China2Collaborative Innovation Center of Geo-Information Technology for Smart Central Plains, Henan Province, Zhengzhou 450001, Henan, China3Key Laboratory of Spatiotemporal Perception and Intelligent Processing, Ministry of Natural Resources, Zhengzhou 450001, Henan, China4Henan Technical College of Construction, Zhengzhou 450001, Henan, Chinashow less
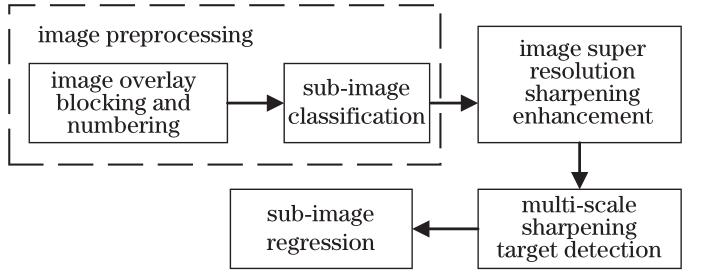
Fig. 1. Entire flow diagram
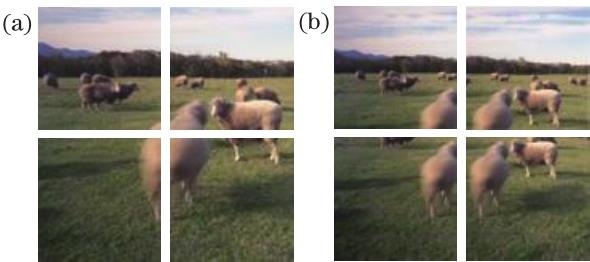
Fig. 2. Image blocking. (a) Direct blocking; (b) overlap blocking
Fig. 3. Schematic of overlap block. (a) Schematic of edge image; (b) schematic of middle image
Fig. 4. Structure map of SR sharpening module
Fig. 5. Multi-scale sharpening target detection model. (a) Overall model; (b) structure of added layer
Fig. 6. Model of edge detection sharpening
Fig. 7. Reconstruction results of each model. (a) Scaling factor of ×2; (b) scaling factor of ×4; (c) scaling factor of ×8
Fig. 8. Visual comparison of target detection effect
| Scale | Method | DIV2K | Set5 | Set14 | BSD100 |
|---|
| PSNR/SSIM | PSNR/SSIM | PSNR/SSIM | PSNR/SSIM |
|---|
| SRCNN | 37.05/0.9458 | 36.66/0.9299 | 30.24/0.8688 | 29.56/0.8431 | | EDSR | 38.55/0.9688 | 38.20/0.9606 | 34.02/0.9204 | 32.57/0.9001 | | ESRGAN | 38.13/0.9664 | 37.63/0.9588 | 33.04/0.9118 | 31.85/0.8942 | | DRN | 37.74/0.9620 | 37.03/0.9513 | 33.98/0.9192 | 32.52/0.8590 | | LIIF-edsr | 34.99/0.9353 | 38.17/0.9365 | 33.97/0.8891 | 32.32/0.8642 | | Proposed mothed | 38.19/0.9698 | 37.94/0.9612 | 33.52/0.9285 | 32.14/0.9108 | | SRCNN | 32.58/0.9052 | 30.49/0.8628 | 27.50/0.7513 | 26.90/0.7101 | | EDSR | 34.12/0.9264 | 32.62/0.8984 | 28.94/0.7901 | 27.71/0.7006 | | ESRGAN | 34.08/0.9118 | 32.60/0.9002 | 28.88/0.7896 | 27.76/0.7432 | | DRN | 34.16/0.9253 | 32.68/0.9010 | 28.93/0.7900 | 27.78/0.7440 | | LIIF-edsr | 29.27/0.8183 | 32.50/0.8511 | 28.80/0.7377 | 27.74/0.7183 | | Proposed mothed | 34.14/0.9310 | 32.52/0.9123 | 28.90/0.8023 | 27.70/0.7520 | | SRCNN | 28.85/0.7110 | 25.33/0.689 | 23.85/0.5930 | 22.31/0.5526 | | EDSR | 27.47/0.7913 | 26.96/0.7750 | 24.91/0.6400 | 23.19/0.5680 | | ESRGAN | 25.72/0.7414 | 26.00/0.7027 | 23.14/0.6577 | 25.96/0.6375 | | DRN | 28.96/0.7861 | 27.41/0.7900 | 25.25/0.6520 | 24.98/0.6050 | | LIIF-edsr | 27.09/0.7422 | 27.14/0.7775 | 25.15/0.6438 | 24.91/0.5832 | | Proposed mothed | 28.93/0.7964 | 26.98/0.7792 | 25.42/0.6623 | 25.66/0.6458 |
|
Table 1. Comparison results obtained by using proposed method and latest SR methods
| Method | Backbone | mAP /% | FPS | GFLOPs | Model size /MB |
|---|
| YOLOv3_Tiny | Darknet-Tiny | 58.2 | 25.0 | 0.48 | 2.3 | | FCOS | ResNet | 76.4 | 14 | 3.9 | 30 | | SSD300 | VGG16 | 77.2 | 46 | 31 | 4.8 | | FSSD | VGG16 | 80.9 | 35.7 | 40 | 6.5 | | DSSD | ResNet101 | 81.5 | 5.5 | 79 | 122 | | TSD | SENet154+DCN | 83.0 | 2.7 | 7.3 | 58.9 | | Proposed method | SSD300 | 85.3 | 28 | 35 | 7.8 |
|
Table 2. Comparison results among proposed method and other methods on PASCAL VOC dataset
| Method | Backbone | mAP | AP50 | AP75 | APS | APM | APL |
|---|
| YOLOv3_Tiny | Darknet-Tiny | 33.0 | 57.9 | 34.4 | 18.3 | 35.4 | 41.9 | | FCOS | ResNet | 44.7 | 64.1 | 48.4 | 27.6 | 47.5 | 55.6 | | SSD300 | VGG16 | 25.1 | 43.1 | 25.8 | 6.6 | 25.9 | 41.4 | | FSSD | VGG16 | 31.8 | 52.8 | 33.5 | 14.2 | 35.1 | 45.0 | | DSSD | ResNet101 | 33.2 | 53.3 | 35.2 | 13.0 | 35.4 | 51.1 | | TSD | SENet154+DCN | 51.2 | 74.9 | 56.0 | 33.8 | 54.8 | 64.2 | | Proposed method | SSD300 | 54.0 | 74.2 | 58.7 | 43.5 | 55.8 | 60.7 |
|
Table 3. Comparison results among our method and other methods on COCO 2017 dataset