• Laser & Optoelectronics Progress
  • Vol. 59, Issue 23, 2330003 (2022)
Yongli Bai1, Xinguo Huang1,*, Shanshan Zhang1, Xian Leng1..., Yunfei Zhong1, Nan Peng2, Xiaochun Xie2 and Nan Peng1|Show fewer author(s)
Author Affiliations
  • 1School of Packaging and Materials Engineering, Hunan University of Technology, Zhuzhou 412007, Hunan , China
  • 2Hunan Luck Printing Co., Ltd., Changsha 410100, Hunan ,China
  • show less
    DOI: 10.3788/LOP202259.2330003 Cite this Article Set citation alerts
    Yongli Bai, Xinguo Huang, Shanshan Zhang, Xian Leng, Yunfei Zhong, Nan Peng, Xiaochun Xie, Nan Peng. Type Identification and Concentration Quantitative Analysis of Water-Based Ink Additives Based on Visible/Near-Infrared Spectroscopy[J]. Laser & Optoelectronics Progress, 2022, 59(23): 2330003 Copy Citation Text show less
    Normalized reflectance spectra of experimental samples
    Fig. 1. Normalized reflectance spectra of experimental samples
    Principal component score distributions of each spectrum interval of different additives. (a) 380-500 nm; (b) 501-616 nm; (c) 617-726 nm; (d) 727-831 nm
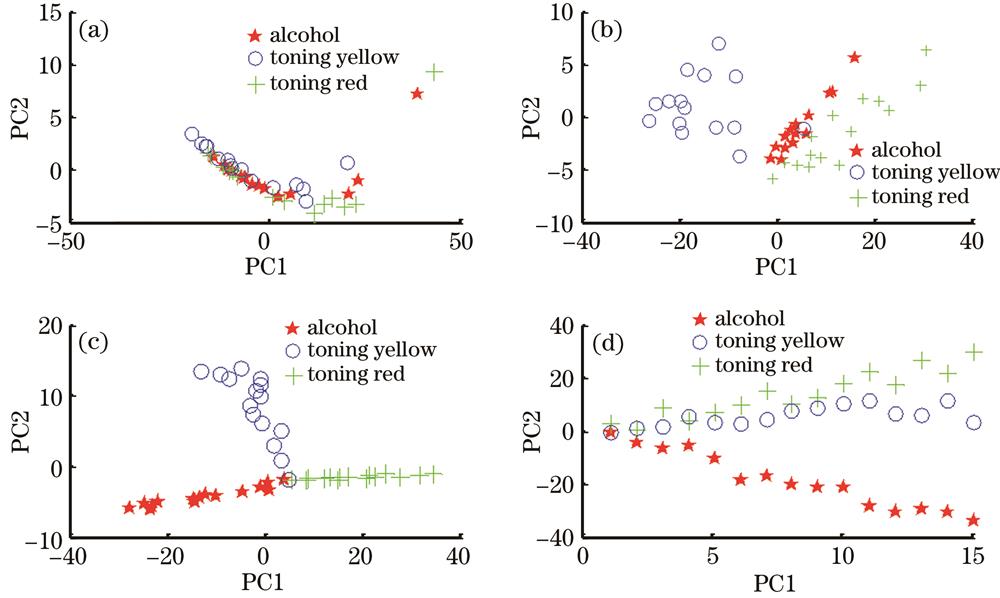
    Fig. 2. Principal component score distributions of each spectrum interval of different additives. (a) 380-500 nm; (b) 501-616 nm; (c) 617-726 nm; (d) 727-831 nm
    Correlation between measured value and predicted value of concentration of alcohol additives
    Fig. 3. Correlation between measured value and predicted value of concentration of alcohol additives
    Correlation between measured value and predicted value of concentration of toning yellow additives
    Fig. 4. Correlation between measured value and predicted value of concentration of toning yellow additives
    Correlation between measured value and predicted value of concentration of toning red additive
    Fig. 5. Correlation between measured value and predicted value of concentration of toning red additive
    No.Mass fraction of alcohol /%No.Mass fraction of toning yellow /%No.Mass fraction of toning red /%
    B10C10D10
    B25.36C21.75D22.37
    B310.21C33.91D34.10
    B415.37C46.02D45.94
    B522.03C57.82D57.81
    B624.93C69.93D69.57
    B730.54C712.53D711.19
    B835.20C814.36D812.21
    B940.64C916.13D914.20
    B1044.94C1018.03D1015.49
    Table 1. Mass fraction of additives added in ink
    Feature interval /nmPrincipal component factorVariance contribution rate /%Cumulative variance contribution rate /%
    380-980PC161.54261.542
    PC227.87189.413
    PC39.38898.801
    380-500PC193.85693.799
    PC22.82796.626
    501-616PC194.65794.657
    PC24.68399.340
    617-726PC185.71785.717
    PC214.19299.909
    727-831PC199.57499.574
    PC20.22499.798
    Table 2. Principal component analysis cumulative variance contribution rate
    Types of additives

    method

    Preprocessing

    Number of main factorsCalibration setPrediction set
    Rc2RMSECRp2RMSEP
    AlcoholMapminmax10.9240.0540.9700.027
    Smoothts-g10.9240.0540.9790.022
    1st10.9090.0590.9930.013
    2st10.7060.1060.9390.039
    SG10.9240.0540.9700.027
    SNV10.9160.0570.9100.047
    Toning yellowMapminmax10.8930.0260.9360.017
    Smoothts-g10.9230.0220.9770.010
    1st10.9720.0130.9870.008
    2st10.7330.0410.7630.026
    SG10.8970.0230.9500.012
    SNV10.9230.0210.9790.008
    Toning redMapminmax10.6270.0410.9060.016
    Smoothts-g10.9730.0110.9980.002
    1st10.5370.0460.7990.024
    2st10.9290.0180.9010.017
    SG10.5690.0440.7870.024
    SNV10.9380.0170.9770.008
    Table 3. Comparison of quantitative cross-validation of PLS under different pretreatment methods
    Types of additivesInterval selection /nm

    method

    Preprocessing

    Calibration setPrediction set
    Rc2RMSECRp2RMSEP
    Alcohol380-500Smoothts-g0.92230.05470.97980.0223
    501-6160.92370.05420.97900.0227
    617-7260.92420.05400.97850.0230
    727-8310.92350.05650.97810.0237
    Toning yellow380-5001st0.97720.01190.97710.0010
    501-6160.97850.01160.98430.0083
    617-7260.87940.02750.98210.0089
    727-8310.97220.01320.98700.0075
    Toning red380-500Smoothts-g0.95180.01480.99480.0038
    501-6160.95100.01490.99290.0036
    617-7260.95330.01450.99320.0043
    727-8310.95180.01470.99460.0039
    Table 4. Comparison of iPLS modeling results in different bands
    Yongli Bai, Xinguo Huang, Shanshan Zhang, Xian Leng, Yunfei Zhong, Nan Peng, Xiaochun Xie, Nan Peng. Type Identification and Concentration Quantitative Analysis of Water-Based Ink Additives Based on Visible/Near-Infrared Spectroscopy[J]. Laser & Optoelectronics Progress, 2022, 59(23): 2330003
    Download Citation