• Laser & Optoelectronics Progress
  • Vol. 62, Issue 8, 0837007 (2025)
Yu Huang1,*, Yanlin Shao1, Wei Wei1, and Qihong Zeng2
Author Affiliations
  • 1School of Geosciences, Yangtze University, Wuhan 430000, Hubei , China
  • 2Research Institute of Petroleum Exploration & Development, Beijing 100083, China
  • show less
    DOI: 10.3788/LOP241980 Cite this Article Set citation alerts
    Yu Huang, Yanlin Shao, Wei Wei, Qihong Zeng. Study on the Decision Tree Model for Carbonate Rock Lithology Identification Based on Hyperspectral Data[J]. Laser & Optoelectronics Progress, 2025, 62(8): 0837007 Copy Citation Text show less
    Schematic diagram of spectral waveform features
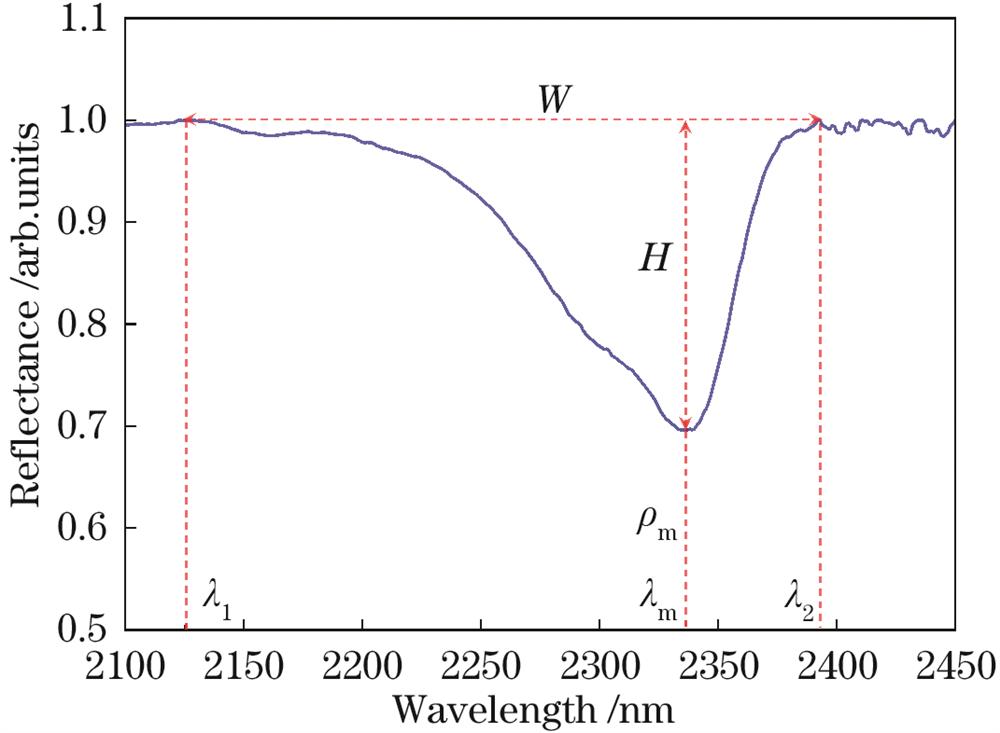
    Fig. 1. Schematic diagram of spectral waveform features
    Technology roadmap of proposed algorithm
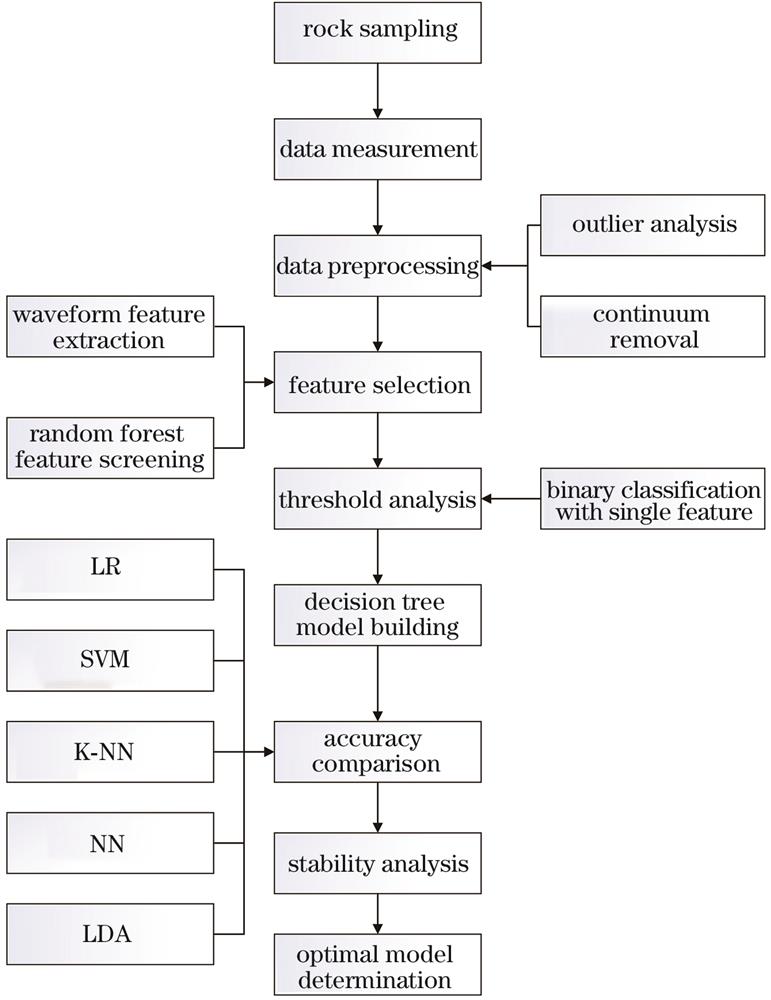
    Fig. 2. Technology roadmap of proposed algorithm
    Spectral curves before and after preprocessing
    Fig. 3. Spectral curves before and after preprocessing
    Ranking of feature importance
    Fig. 4. Ranking of feature importance
    Box plots of particial features. (a) Absorption bandwidth; (b) right shoulder wavelength of the absorption band; (c) the lowest point wavelength of the absorption valley
    Fig. 5. Box plots of particial features. (a) Absorption bandwidth; (b) right shoulder wavelength of the absorption band; (c) the lowest point wavelength of the absorption valley
    Scatter plot of particial features
    Fig. 6. Scatter plot of particial features
    Classification accuracy of different features at different thresholds. (a) Right shoulder wavelength of the absorption band and the lowest point wavelength of the absorption valley; (b) absorption bandwidth
    Fig. 7. Classification accuracy of different features at different thresholds. (a) Right shoulder wavelength of the absorption band and the lowest point wavelength of the absorption valley; (b) absorption bandwidth
    Decision tree model accuracy under different feature combinations
    Fig. 8. Decision tree model accuracy under different feature combinations
    Processing flowchart of decision tree
    Fig. 9. Processing flowchart of decision tree
    Classification accuracy of different features for different test sets. (a) The lowest point wavelength of the absorption valley; (b) right shoulder wavelength of the absorption band; (c) absorption bandwidth
    Fig. 10. Classification accuracy of different features for different test sets. (a) The lowest point wavelength of the absorption valley; (b) right shoulder wavelength of the absorption band; (c) absorption bandwidth
    Actual classPredicted class
    PositiveNegative
    PositiveNTPNFN
    NegativeNFPNTN
    Table 1. Confusion matrix
    ModelAccuracyModelAccuracy
    LR92.04NN93.81
    SVM92.92LDA90.27
    K-NN91.34Proposed95.57
    Table 2. Comparison of accuracy among different models
    Test set proportionλmλ2Wλ1DHQSAISρm
    0.10.260.240.150.100.060.050.050.050.04
    0.20.210.240.170.130.050.060.050.040.05
    0.30.240.220.180.120.060.050.050.040.04
    Table 3. Feature importance under different test set proportions
    ActualPredicted
    DolostoneLimestone
    Dolostone773
    Limestone231
    Table 4. Confusion matrix by decision tree model
    Yu Huang, Yanlin Shao, Wei Wei, Qihong Zeng. Study on the Decision Tree Model for Carbonate Rock Lithology Identification Based on Hyperspectral Data[J]. Laser & Optoelectronics Progress, 2025, 62(8): 0837007
    Download Citation