• Infrared and Laser Engineering
  • Vol. 53, Issue 7, 20240133 (2024)
Yingjie RUAN1,2,3, Yan HE1,2,3, Deliang LV1,2,3, Chunhe HOU1,2,3..., Guangxiu XU4, Chaoran ZHANG4, Yifan HUANG1,2,3 and Xinke HAO1,2,3|Show fewer author(s)
Author Affiliations
  • 1Wangzhijiang Innovation Center for Laser, Aerospace Laser Technology and System Department, Shanghai Institute of Optics and Fine Mechanics, Chinese Academy of Sciences, Shanghai 201800, China
  • 2Key Laboratory of Space Laser Communication and Detection Technology, Shanghai Institute of Optics and Fine Mechanics, Chinese Academy of Sciences, Shanghai 201800, China
  • 3Center of Materials Science and Optoelectronics Engineering, University of Chinese Academy of Science, Beijing 100049, China
  • 4Naval Research Institute, Tianjin 300061, China
  • show less
    DOI: 10.3788/IRLA20240133 Cite this Article
    Yingjie RUAN, Yan HE, Deliang LV, Chunhe HOU, Guangxiu XU, Chaoran ZHANG, Yifan HUANG, Xinke HAO. LiDAR profile image processing method for underwater obstacle[J]. Infrared and Laser Engineering, 2024, 53(7): 20240133 Copy Citation Text show less
    Unmanned airborne ocean LiDAR
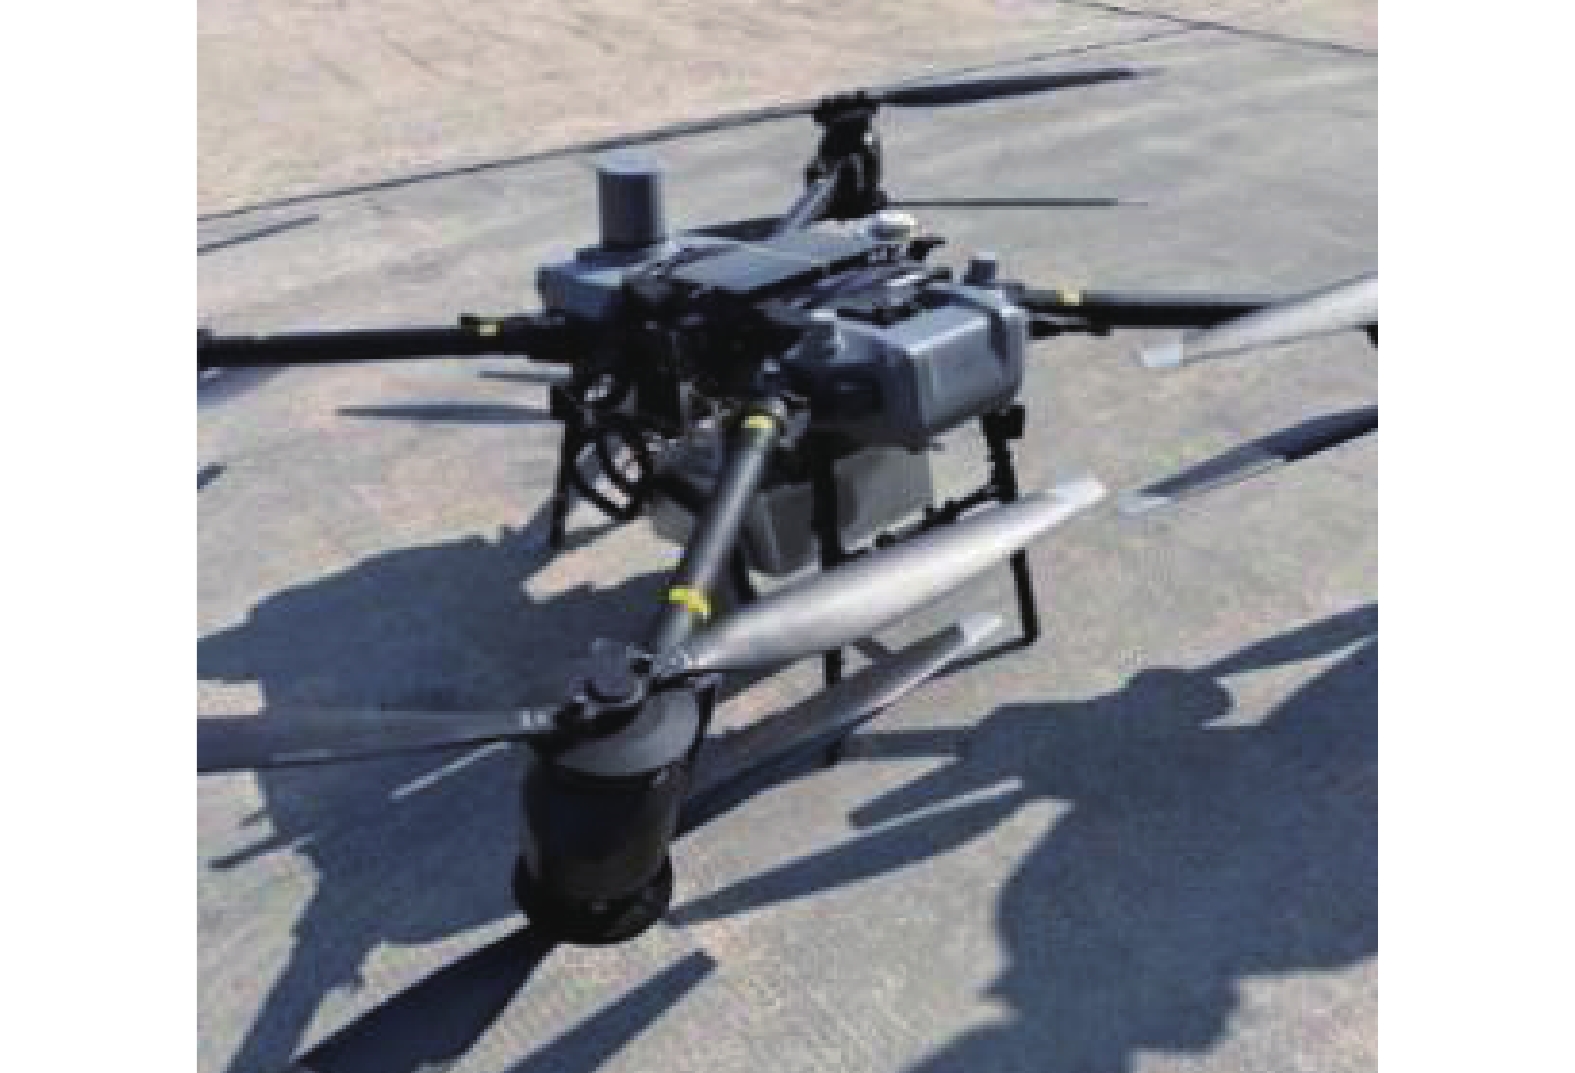
    Fig. 1. Unmanned airborne ocean LiDAR
    Schematic diagram of the receiving optical path
    Fig. 2. Schematic diagram of the receiving optical path
    Photograph of the obstacle
    Fig. 3. Photograph of the obstacle
    Multi-channel waveform data obtained by airborne experiment
    Fig. 4. Multi-channel waveform data obtained by airborne experiment
    Echo energy profile
    Fig. 5. Echo energy profile
    Local echo energy profiles of underwater obstacle
    Fig. 6. Local echo energy profiles of underwater obstacle
    Schematic diagram of the principle of linear-approximation of leading edge algorithm
    Fig. 7. Schematic diagram of the principle of linear-approximation of leading edge algorithm
    Modeling of laser emission angle
    Fig. 8. Modeling of laser emission angle
    Echo energy profile after angle correction
    Fig. 9. Echo energy profile after angle correction
    Histogram of water surface height statistics
    Fig. 10. Histogram of water surface height statistics
    Local echo energy profile of underwater obstacle after angle correction
    Fig. 11. Local echo energy profile of underwater obstacle after angle correction
    Obstacle echo profile edge extraction results of adjacent scan lines
    Fig. 12. Obstacle echo profile edge extraction results of adjacent scan lines
    Depth of the centroid of obstacle contours
    Fig. 13. Depth of the centroid of obstacle contours
    The 20 sample images used for validating automatic recognition
    Fig. 14. The 20 sample images used for validating automatic recognition
    Schematic diagram of the water background region extraction
    Fig. 15. Schematic diagram of the water background region extraction
    ParameterValue
    Wavelength/nm532.1
    Pulse energy/mJ0.1
    Laser frequency/Hz2000
    Pulse width/ns1.9
    Divergence angle/mrad2.4
    Receiving diameter/mm50
    Field of view/mrad90
    Sample rate/ns1
    Table 1. Parameters of the LiDAR
    Image labelSimilarity
    Fig.12(b)Fig.12(c)Fig.12(d)Fig.12(e)Fig.12(f)
    Fig.12(a)99.52%99.27%98.38%99.86%99.92%
    Fig.12(b)99.97%99.66%98.86%99.06%
    Fig.12(c)99.82%98.50%98.72%
    Fig.12(d)97.29%97.60%
    Fig.12(e)99.99%
    Table 2. Image contour similarity
    Image No.$ {s}^{2} $Image No.$ {s}^{2} $
    Fig.14(a)28.47Fig.14(k)235.43
    Fig.14(b)36.18Fig.14(l)245.75
    Fig.14(c)65.63Fig.14(m)276.09
    Fig.14(d)148.38Fig.14(n)311.97
    Fig.14(e)147.55Fig.14(o)240.61
    Fig.14(f)173.46Fig.14(p)159.66
    Fig.14(g)257.78Fig.14(q)117.99
    Fig.14(h)203.27Fig.14(r)109.83
    Fig.14(i)332.11Fig.14(s)27.85
    Fig.14(j)257.93Fig.14(t)21.63
    Table 3. Variance of the amplitude in test samples
    Yingjie RUAN, Yan HE, Deliang LV, Chunhe HOU, Guangxiu XU, Chaoran ZHANG, Yifan HUANG, Xinke HAO. LiDAR profile image processing method for underwater obstacle[J]. Infrared and Laser Engineering, 2024, 53(7): 20240133
    Download Citation