• Laser & Optoelectronics Progress
  • Vol. 59, Issue 14, 1415011 (2022)
Lina Fu1, Jingwen Yang1, Yanling Li1, Zonghua Zhang1,*..., Nan Gao1, Zhaozong Meng1, Feng Gao2 and Xiangqian Jiang2|Show fewer author(s)
Author Affiliations
  • 1School of Mechanical Engineering, Hebei University of Technology, Tianjin 300130, China
  • 2Centre for Precision Technologies, University of Huddersfield, HuddersfieldHD1 3DH, UK
  • show less
    DOI: 10.3788/LOP202259.1415011 Cite this Article Set citation alerts
    Lina Fu, Jingwen Yang, Yanling Li, Zonghua Zhang, Nan Gao, Zhaozong Meng, Feng Gao, Xiangqian Jiang. Binary Fringe Defocused Projection Technology: A Review[J]. Laser & Optoelectronics Progress, 2022, 59(14): 1415011 Copy Citation Text show less
    Principle of defocusing projection. (a) Defocusing imaging; (b) defocusing area division
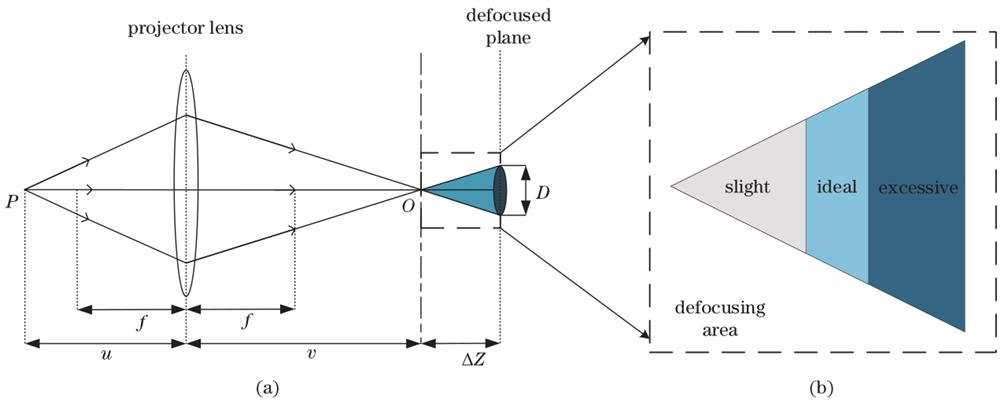
    Fig. 1. Principle of defocusing projection. (a) Defocusing imaging; (b) defocusing area division
    Binary fringe with different defocusing level. (a) Original fringe; (b)‒(d) binary images with increasing defocusing level
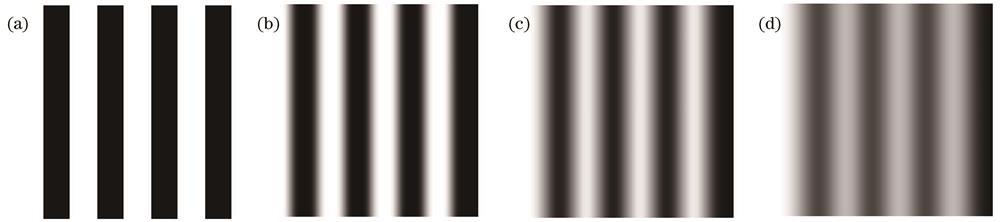
    Fig. 2. Binary fringe with different defocusing level. (a) Original fringe; (b)‒(d) binary images with increasing defocusing level
    Property of square wave signal. (a) Harmonic distribution; (b) harmonic attenuation
    Fig. 3. Property of square wave signal. (a) Harmonic distribution; (b) harmonic attenuation
    Fliter with different Guassion kernels
    Fig. 4. Fliter with different Guassion kernels
    Comparison before and after filtering. (a) Pre-defocus signal; (b) defocused signal; (c) frequency spectrum of Fig.5 (a); (d) frequency spectrum of Fig.5 (b)
    Fig. 5. Comparison before and after filtering. (a) Pre-defocus signal; (b) defocused signal; (c) frequency spectrum of Fig.5 (a); (d) frequency spectrum of Fig.5 (b)
    Schematic of TRP chip[39]. (a) -17°; (b) +17°
    Fig. 6. Schematic of TRP chip[39]. (a) -17°; (b) +17°
    Frequency-spectrum diagram of SPWM fringe with different modulation frequency. (a) k=9; (b) k=13
    Fig. 7. Frequency-spectrum diagram of SPWM fringe with different modulation frequency. (a) k=9; (b) k=13
    Bayer dithering technique for sinusoidal image[81]. (a) Original sinusoidal image; (b) image obtained by Bayer dithering for Fig.8(a)
    Fig. 8. Bayer dithering technique for sinusoidal image[81]. (a) Original sinusoidal image; (b) image obtained by Bayer dithering for Fig.8(a)
    Framework of Bayer dithering optimization algorithm[88]
    Fig. 9. Framework of Bayer dithering optimization algorithm[88]
    Schematic of S-SD method[97]. (a) Scanning sequence of S-SD; (b) error diffusion
    Fig. 10. Schematic of S-SD method[97]. (a) Scanning sequence of S-SD; (b) error diffusion
    Combining binary fringe projection process[106]
    Fig. 11. Combining binary fringe projection process[106]
    NHarmonic order
    2345678910
    3
    4
    5
    6
    7
    8
    9
    Table 1. Sensitivity of N-step phase shifting algorithm to harmonics
    ModeMethodReferenceSpeedAccuracyComplexity
    SBM30HighLowLow
    1DSPWM65HighMediumMedium
    OPWM66MediumHighHigh
    TPWM71MediumHighMedium
    D-TPWM73MediumHighHigh
    2DBayer81HighLowLow
    P-Bayer82MediumMediumMedium
    I-Bayer83MediumLowMedium
    FSD94MediumMediumMedium
    S-FSD106MediumHighHigh
    SD96MediumMediumMedium
    S-SD97MediumHighHigh
    GA103LowHighHigh
    O-GA104MediumHighHigh
    Table 2. Performance comparison of different fringe modulation methods
    Lina Fu, Jingwen Yang, Yanling Li, Zonghua Zhang, Nan Gao, Zhaozong Meng, Feng Gao, Xiangqian Jiang. Binary Fringe Defocused Projection Technology: A Review[J]. Laser & Optoelectronics Progress, 2022, 59(14): 1415011
    Download Citation