• Chinese Journal of Lasers
  • Vol. 52, Issue 6, 0611001 (2025)
Jinmei Wang1, Zhi Yang1, Peichao Zheng1,*, Guanghui Chen1..., Xufeng Liu1, Zhicheng Sun1, Daming Dong2,3, Hongwu Tian2,3 and Lianbo Guo4|Show fewer author(s)
Author Affiliations
  • 1Chongqing Municipal Key Laboratory of Photoelectric Information Sensing and Transmission Technology, College of Optoelectronic Engineering, Chongqing University of Posts and Telecommunications, Chongqing 400065, China
  • 2Research Center of Intelligent Equipment, Beijing Academy of Agriculture and Forestry Sciences, Beijing 100097, China
  • 3Key Laboratory of Agricultural Sensors, Ministry of Agriculture and Rural Affairs, Beijing 100097, China
  • 4Wuhan National Laboratory for Optoelectronics, Huazhong University of Science and Technology, Wuhan 430074, Hubei , China
  • show less
    DOI: 10.3788/CJL241179 Cite this Article Set citation alerts
    Jinmei Wang, Zhi Yang, Peichao Zheng, Guanghui Chen, Xufeng Liu, Zhicheng Sun, Daming Dong, Hongwu Tian, Lianbo Guo. Analysis of Cu Elements in Soil by Spatially Constrained LIBS Combined with Resin Enrichment[J]. Chinese Journal of Lasers, 2025, 52(6): 0611001 Copy Citation Text show less
    Diagram of LIBS experimental setup
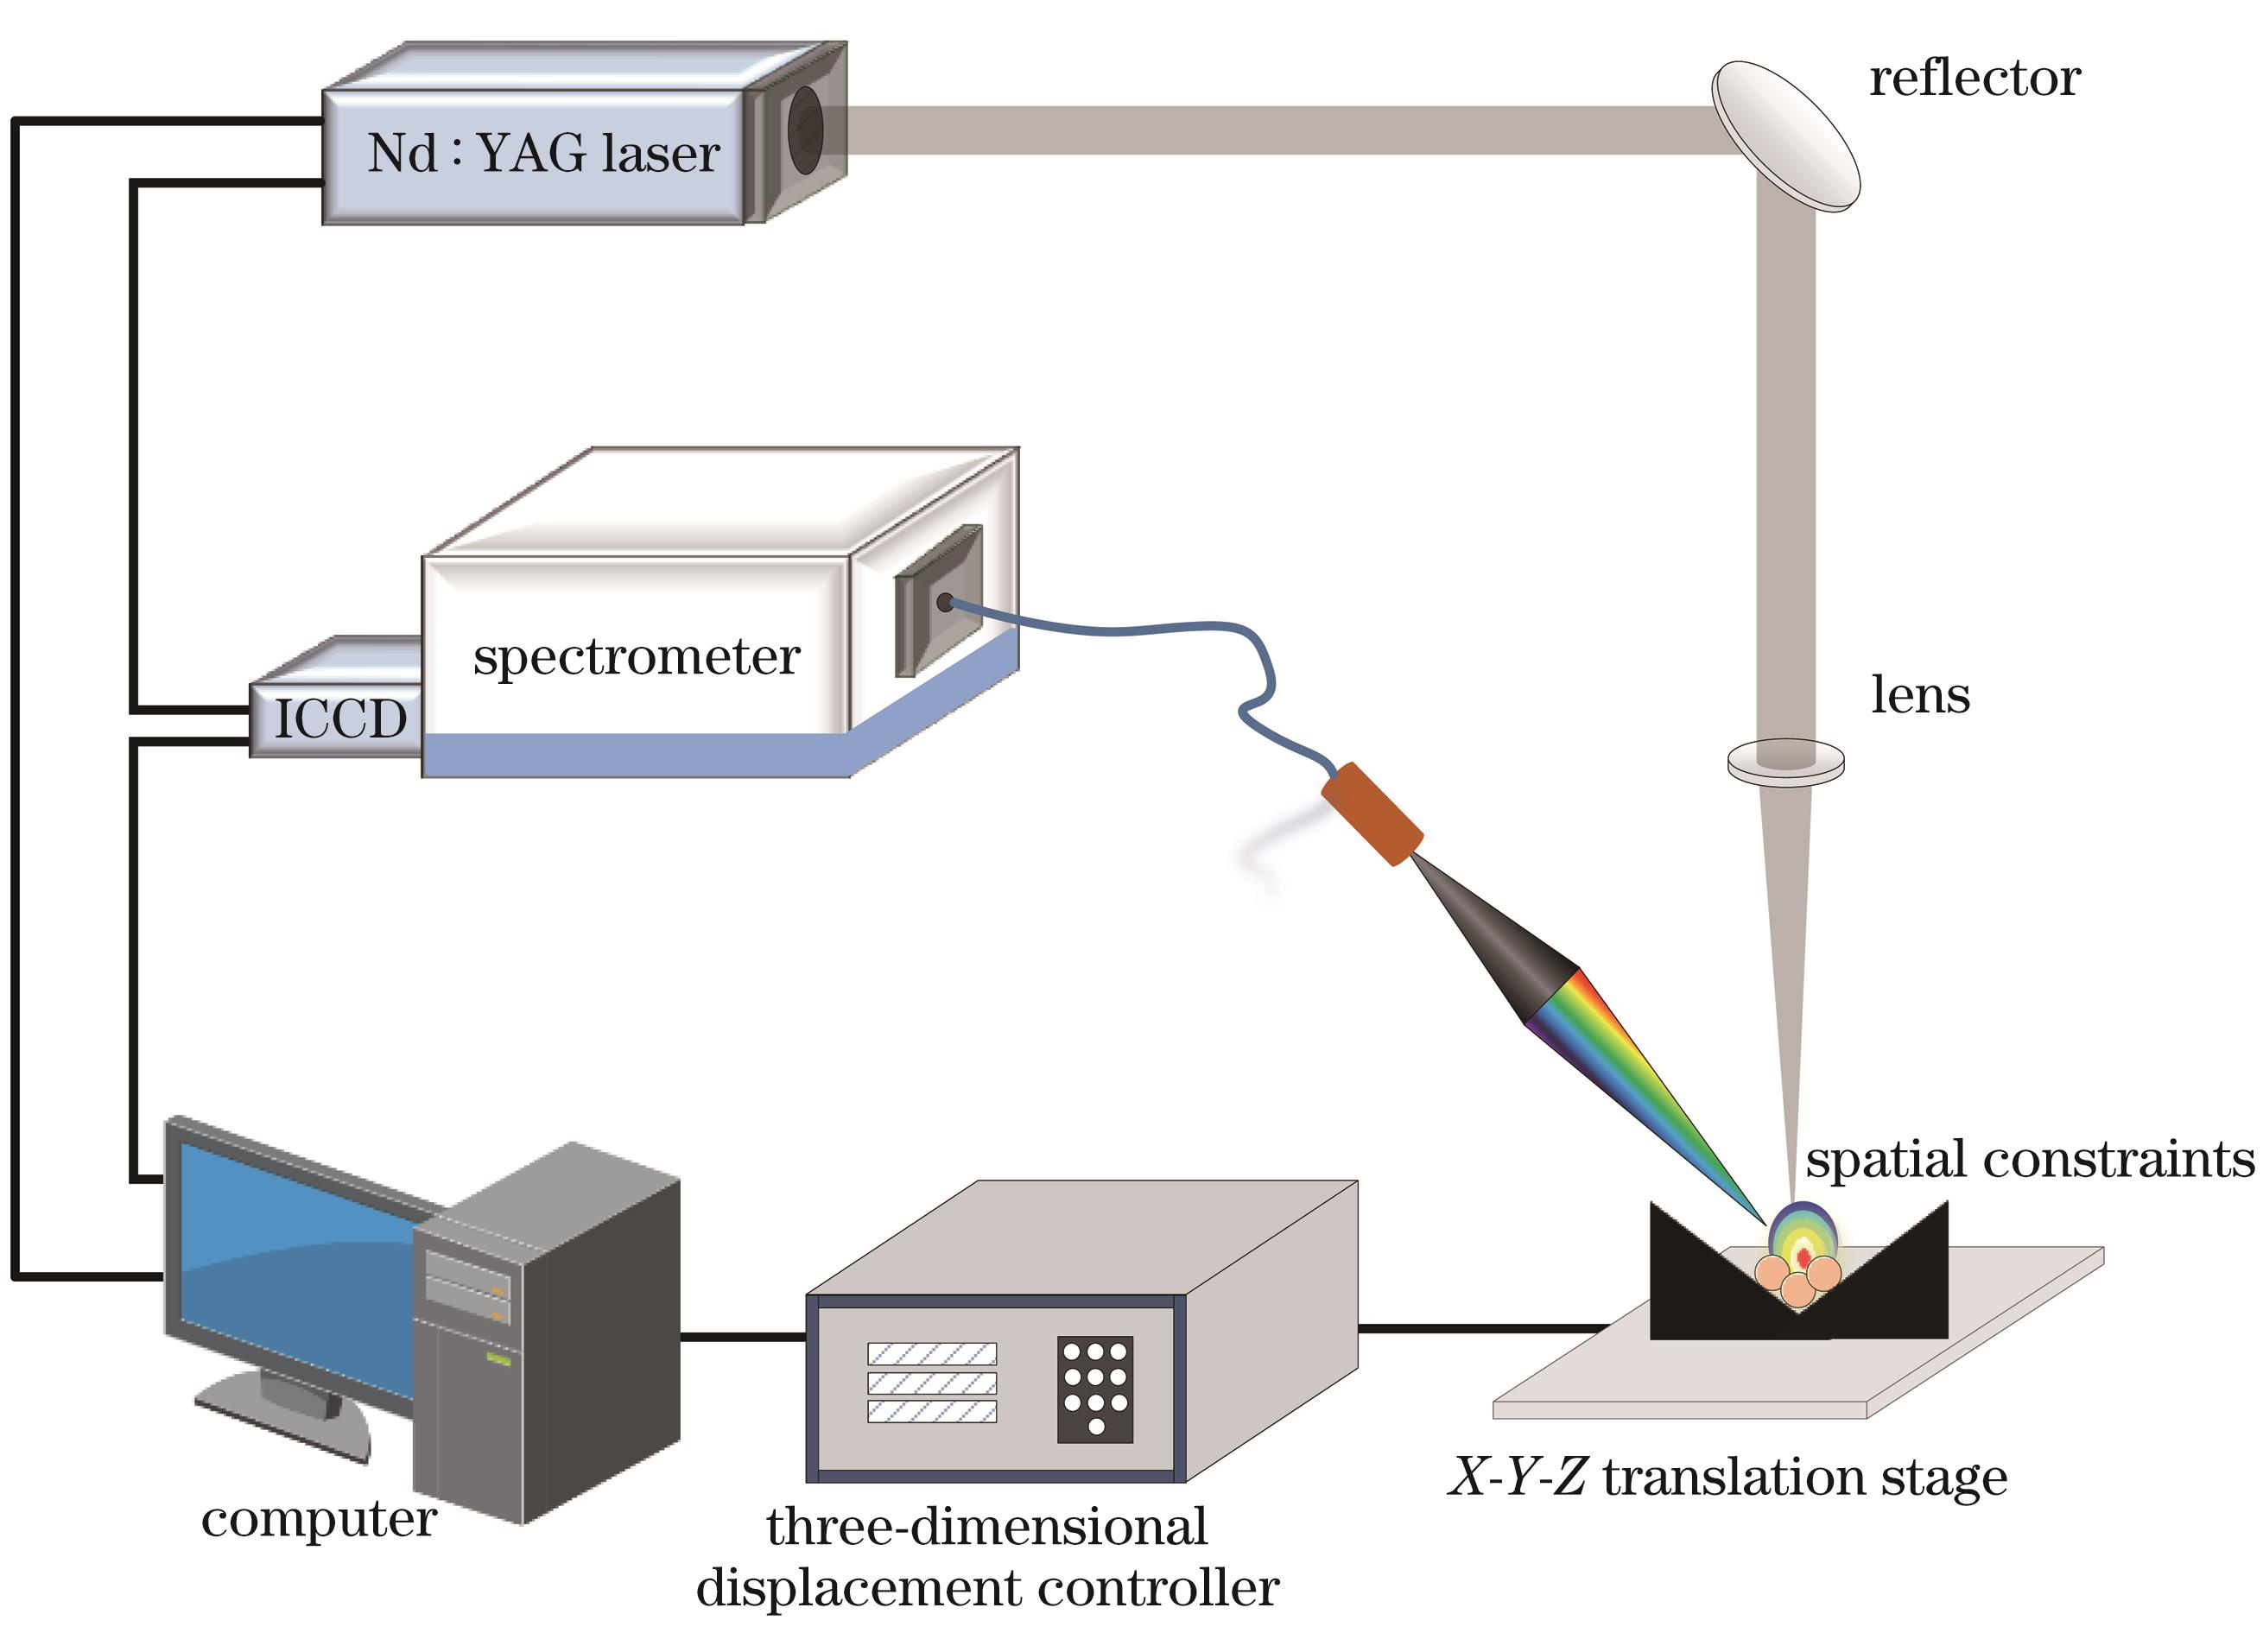
    Fig. 1. Diagram of LIBS experimental setup
    LIBS sample preparation process for detection of soil heavy metals
    Fig. 2. LIBS sample preparation process for detection of soil heavy metals
    Spectral line selection. (a) Comparison of spectra before and after enrichment of chelating resins; (b) comparison of spectral intensity between resin enrichment method and soil tableting method
    Fig. 3. Spectral line selection. (a) Comparison of spectra before and after enrichment of chelating resins; (b) comparison of spectral intensity between resin enrichment method and soil tableting method
    Effects of enrichment time on intensity values of Cu characteristic lines
    Fig. 4. Effects of enrichment time on intensity values of Cu characteristic lines
    Effects of resin dosage on intensity values of Cu characteristic spectral lines
    Fig. 5. Effects of resin dosage on intensity values of Cu characteristic spectral lines
    Effects of pH value on intensity values of Cu characteristic lines
    Fig. 6. Effects of pH value on intensity values of Cu characteristic lines
    Effects of laser energy on intensity values of Cu characteristic lines. (a) Cu I 324.75 nm; (b) Cu I 327.39 nm
    Fig. 7. Effects of laser energy on intensity values of Cu characteristic lines. (a) Cu I 324.75 nm; (b) Cu I 327.39 nm
    Effects of ICCD delay time on intensity values of Cu characteristic lines. (a) Cu I 324.75 nm; (b) Cu I 327.39 nm
    Fig. 8. Effects of ICCD delay time on intensity values of Cu characteristic lines. (a) Cu I 324.75 nm; (b) Cu I 327.39 nm
    Space constraint device. (a) Enhancement effect of plasma; (b) V-shaped space constraint device
    Fig. 9. Space constraint device. (a) Enhancement effect of plasma; (b) V-shaped space constraint device
    Effects of spatial constraint on intensity values of Cu characteristic lines. (a) Cu I 324.75 nm; (b) Cu I 327.39 nm
    Fig. 10. Effects of spatial constraint on intensity values of Cu characteristic lines. (a) Cu I 324.75 nm; (b) Cu I 327.39 nm
    Comparison of calibration curves before and after adding spatial constraint. (a) Cu I 324.75 nm;(b) Cu I 327.39 nm
    Fig. 11. Comparison of calibration curves before and after adding spatial constraint. (a) Cu I 324.75 nm;(b) Cu I 327.39 nm
    Detection methodLOD /(mg/kg)Ref.
    Spatially constrained LIBS combined with resin enrichment0.617This work
    LIBS direct measurement6722
    Microwave-assisted LIBS method3023
    Soil tableting LIBS method824
    Mobile LIBS6.2825
    LIBS coupled to external magnetic field1.426
    Table 1. Comparison of analytical performance of different methods for detecting Cu elements in soil
    Standard sample

    Spiked mass

    fraction /(mg/kg)

    Cu I 324.75 nmCu I 327.39 nm

    Observed mass

    fraction /(mg/kg)

    Recovery

    rate /%

    Observed mass

    fraction /(mg/kg)

    Recovery

    rate /%

    GBW74515049.3398.6648.6897.36
    130127.0397.71125.3596.43
    GBW74565046.7093.4052.29104.58
    130133.08102.37131.15100.88
    Table 2. Standard samples and their spiked recovery rates
    Jinmei Wang, Zhi Yang, Peichao Zheng, Guanghui Chen, Xufeng Liu, Zhicheng Sun, Daming Dong, Hongwu Tian, Lianbo Guo. Analysis of Cu Elements in Soil by Spatially Constrained LIBS Combined with Resin Enrichment[J]. Chinese Journal of Lasers, 2025, 52(6): 0611001
    Download Citation