Author Affiliations
1College of Geographic Sciences, Hunan Normal University, Changsha 410081, Hunan, China2Hunan Key Laboratory of Geospatial Big Data Mining and Application, Changsha 410081, Hunan, Chinashow less
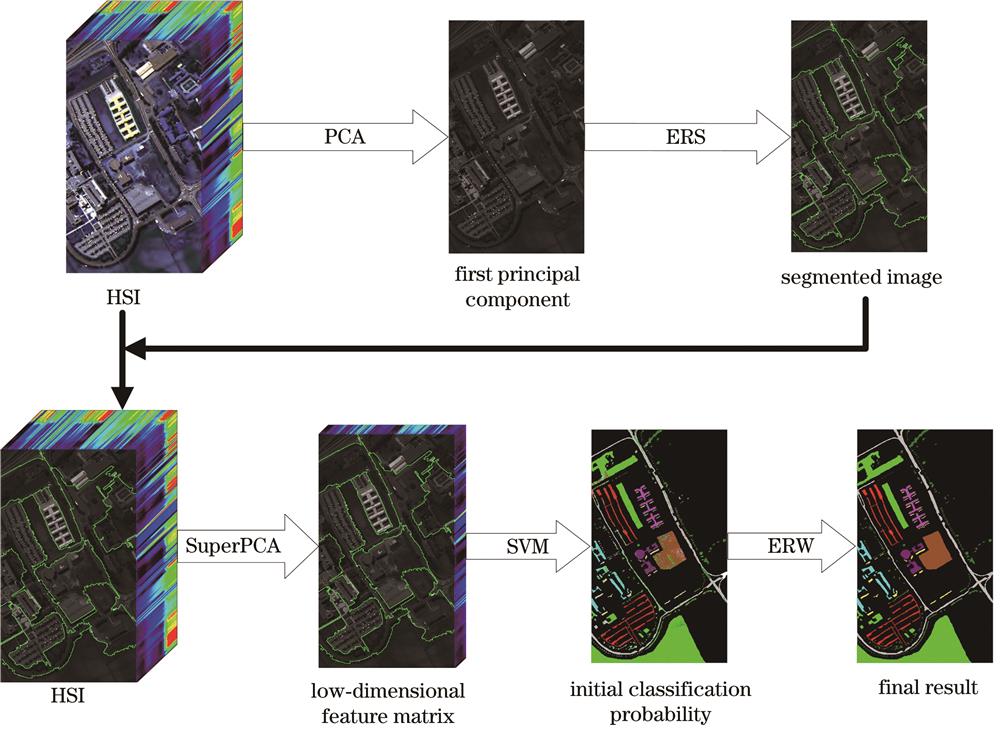
Fig. 1. Hyperspectral image classification framework based on SE_SVM
Fig. 2. False-color image (bands 34, 17, 10) and ground truth label map of Indian Pines dataset
Fig. 3. False-color image (bands 68, 27, 19) and ground truth label map of Pavia University dataset
Fig. 4. False-color image (bands 68, 27, 19) and ground truth label map of Salinas dataset
Fig. 5. Line graphs of overall classification accuracy of hyperspectral dataset with the number of principal components and the number of superpixels
Fig. 6. Classification result graphs of seven methods on Indian Pines dataset. (a) Ground truth label map; (b) SVM; (c) PCA_SVM; (d) SPCA_SVM; (e) ERW_SVM; (f) 3DCNN; (g) SSRN; (h) SE_SVM
Fig. 7. Classification result graphs of seven methods on the Pavia University dataset. (a) Ground truth label map; (b) SVM; (c) PCA_SVM;(d) SPCA_SVM; (e) ERW_SVM; (f) 3DCNN; (g) SSRN; (h) SE_SVM
Fig. 8. Classification result graphs of seven methods on the Salinas dataset. (a) Ground truth label map; (b) SVM; (c) PCA_SVM; (d) SPCA_SVM; (e) ERW_SVM; (f) 3DCNN; (g) SSRN; (h) SE_SVM
| Label | Class | Labeled sample | Training | Validation | Test |
|---|
| Total | 10249 | 512 | 511 | 9226 | | 1 | Alfalfa | 46 | 3 | 2 | 41 | | 2 | Corn-notill | 1428 | 71 | 71 | 1286 | | 3 | Corn-mintill | 830 | 43 | 43 | 744 | | 4 | Corn | 237 | 12 | 12 | 213 | | 5 | Grass-pasture | 483 | 24 | 24 | 435 | | 6 | Grass-trees | 730 | 36 | 36 | 658 | | 7 | Grass-pasture-mowed | 28 | 2 | 1 | 25 | | 8 | Hay-windrowed | 478 | 24 | 24 | 430 | | 9 | Oats | 20 | 1 | 1 | 18 | | 10 | Soybean-notill | 972 | 48 | 48 | 876 | | 11 | Soybean-mintill | 2455 | 122 | 122 | 2211 | | 12 | Soybean-clean | 593 | 30 | 30 | 533 | | 13 | Wheat | 205 | 10 | 10 | 185 | | 14 | Woods | 1265 | 63 | 63 | 1139 | | 15 | Buildings-Grass-Trees-Drives | 386 | 19 | 19 | 348 | | 16 | Stone-Steel-Towers | 93 | 4 | 5 | 84 |
|
Table 1. Data partitioning of Indian Pines dataset
| Label | Class | Labeled sample | Training | Validation | Test |
|---|
| Total | 42776 | 426 | 426 | 41924 | | 1 | Asphalt | 6631 | 66 | 66 | 6499 | | 2 | Meadows | 18649 | 186 | 186 | 18277 | | 3 | Gravel | 2099 | 21 | 21 | 2057 | | 4 | Trees | 3064 | 31 | 31 | 3002 | | 5 | Painted metal sheets | 1345 | 13 | 13 | 1319 | | 6 | Bare Soil | 5029 | 50 | 50 | 4929 | | 7 | Bitumen | 1330 | 13 | 13 | 1304 | | 8 | Self-Blocking Bricks | 3682 | 37 | 37 | 3608 | | 9 | Shadows | 947 | 9 | 9 | 929 |
|
Table 2. Data partitioning of Pavia University dataset
| Label | Class | Labeled sample | Training | Validation | Test |
|---|
| Total | 54129 | 542 | 542 | 53045 | | 1 | Brocoli_green_weeds_1 | 2009 | 20 | 20 | 1969 | | 2 | Brocoli_green_weeds_2 | 3726 | 37 | 37 | 3652 | | 3 | Fallow | 1976 | 20 | 20 | 1936 | | 4 | Fallow_rough_plow | 1394 | 14 | 14 | 1366 | | 5 | Fallow_smooth | 2678 | 27 | 27 | 2624 | | 6 | Stubble | 3959 | 40 | 40 | 3879 | | 7 | Celery | 3579 | 36 | 36 | 3507 | | 8 | Grapes_untrained | 11271 | 112 | 112 | 11047 | | 9 | Soil_vinyard_develop | 6203 | 62 | 62 | 6079 | | 10 | Corn_senesced_green_weeds | 3278 | 33 | 33 | 3212 | | 11 | Lettuce_romaine_4wk | 1068 | 11 | 11 | 1046 | | 12 | Lettuce_romaine_5wk | 1927 | 19 | 19 | 1889 | | 13 | Lettuce_romaine_6wk | 916 | 9 | 9 | 898 | | 14 | Lettuce_romaine_7wk | 1070 | 11 | 11 | 1048 | | 15 | Vinyard_untrained | 7268 | 73 | 73 | 7122 | | 16 | Vinyard_vertical_trellis | 1807 | 18 | 18 | 1771 |
|
Table 3. Data partitioning of Salinas dataset
| Label | SVM | PCA_SVM | SPCA_SVM | ERW_SVM | 3DCNN | SSRN | SE_SVM |
|---|
| 1 | 0.00 | 16.73 | 0.00 | 100.00 | 26.83 | 36.59 | 100.00 | | 2 | 61.95 | 52.39 | 93.23 | 95.84 | 81.17 | 96.81 | 97.56 | | 3 | 69.03 | 62.02 | 92.67 | 98.40 | 79.65 | 98.13 | 98.42 | | 4 | 57.75 | 50.24 | 91.86 | 99.13 | 67.14 | 69.48 | 94.51 | | 5 | 85.68 | 75.75 | 97.78 | 98.54 | 86.21 | 97.70 | 99.20 | | 6 | 83.66 | 78.86 | 99.69 | 95.76 | 97.26 | 99.70 | 98.72 | | 7 | 0.00 | 0.00 | 0.00 | 99.50 | 36.00 | 0.00 | 98.80 | | 8 | 85.07 | 90.09 | 100.00 | 99.26 | 99.77 | 100.00 | 100.00 | | 9 | 0.00 | 0.00 | 0.00 | 100.00 | 0.00 | 0.00 | 98.00 | | 10 | 74.08 | 64.40 | 94.42 | 97.57 | 91.31 | 97.14 | 98.57 | | 11 | 67.99 | 58.10 | 91.32 | 96.72 | 84.48 | 98.51 | 98.05 | | 12 | 59.86 | 50.14 | 87.28 | 95.70 | 66.48 | 92.70 | 96.81 | | 13 | 91.84 | 91.34 | 100.00 | 99.74 | 98.38 | 100.00 | 99.79 | | 14 | 89.88 | 83.89 | 99.30 | 95.31 | 98.42 | 100.00 | 98.94 | | 15 | 59.72 | 55.80 | 98.52 | 98.64 | 72.62 | 94.24 | 99.83 | | 16 | 98.29 | 97.61 | 97.66 | 96.21 | 25.00 | 38.10 | 98.90 | | OA | 73.28 | 65.99 | 94.38 | 96.84 | 85.00 | 95.99 | 98.29 | | AA | 61.55 | 57.96 | 77.73 | 97.90 | 69.42 | 76.19 | 98.51 | | Kappa | 69.12 | 60.21 | 93.57 | 96.40 | 82.89 | 95.42 | 98.05 |
|
Table 4. Classification accuracy achieved by seven different methods on Indian Pines dataset
| Label | SVM | PCA_SVM | SPCA_SVM | ERW_SVM | 3DCNN | SSRN | SE_SVM |
|---|
| 1 | 84.80 | 80.70 | 78.26 | 94.61 | 89.00 | 99.45 | 94.37 | | 2 | 91.89 | 89.08 | 96.45 | 96.65 | 97.76 | 98.73 | 97.34 | | 3 | 77.97 | 73.95 | 86.21 | 99.84 | 86.78 | 88.24 | 98.69 | | 4 | 94.15 | 89.46 | 96.85 | 99.54 | 89.48 | 90.41 | 98.57 | | 5 | 98.94 | 100.00 | 99.74 | 99.49 | 89.38 | 99.93 | 99.92 | | 6 | 85.35 | 84.04 | 95.87 | 97.80 | 78.86 | 99.19 | 97.43 | | 7 | 81.84 | 66.80 | 69.15 | 100.00 | 81.20 | 95.09 | 99.72 | | 8 | 76.25 | 68.84 | 80.82 | 97.57 | 82.32 | 89.95 | 98.47 | | 9 | 100.00 | 99.99 | 99.08 | 99.80 | 94.40 | 98.72 | 99.73 | | OA | 88.21 | 84.83 | 91.08 | 97.06 | 90.86 | 96.96 | 97.29 | | AA | 87.91 | 83.65 | 89.16 | 98.37 | 87.68 | 95.52 | 98.25 | | Kappa | 84.19 | 79.54 | 88.07 | 96.07 | 87.82 | 96.02 | 96.38 |
|
Table 5. Classification accuracy achieved by seven different methods on Pavia University dataset
| Label | SVM | PCA_SVM | SPCA_SVM | ERW_SVM | 3DCNN | SSRN | SE_SVM |
|---|
| 1 | 99.52 | 98.98 | 100.00 | 100.00 | 97.16 | 99.44 | 99.99 | | 2 | 99.10 | 98.53 | 100.00 | 100.00 | 100.00 | 100.00 | 100.00 | | 3 | 93.51 | 90.76 | 100.00 | 99.30 | 99.48 | 100.00 | 99.86 | | 4 | 97.76 | 98.66 | 96.30 | 96.08 | 99.56 | 99.93 | 98.52 | | 5 | 98.05 | 93.56 | 97.79 | 99.99 | 95.01 | 97.48 | 99.97 | | 6 | 99.95 | 99.82 | 100.00 | 100.00 | 99.90 | 100.00 | 99.97 | | 7 | 98.38 | 97.83 | 99.99 | 99.85 | 97.38 | 99.91 | 99.95 | | 8 | 74.15 | 72.72 | 98.98 | 97.36 | 92.80 | 85.79 | 99.98 | | 9 | 98.69 | 97.75 | 99.03 | 99.98 | 99.87 | 100.00 | 100.00 | | 10 | 85.11 | 88.60 | 95.35 | 98.70 | 94.43 | 97.54 | 98.42 | | 11 | 91.71 | 90.66 | 92.89 | 99.74 | 91.98 | 95.32 | 100.00 | | 12 | 95.74 | 97.67 | 93.40 | 100.00 | 98.73 | 100.00 | 100.00 | | 13 | 96.49 | 96.13 | 100.00 | 99.24 | 98.55 | 97.88 | 99.39 | | 14 | 97.06 | 97.15 | 97.04 | 99.32 | 98.28 | 98.76 | 95.00 | | 15 | 73.66 | 76.39 | 99.99 | 99.12 | 70.67 | 97.29 | 99.87 | | 16 | 98.34 | 99.69 | 100.00 | 100.00 | 91.81 | 97.97 | 100.00 | | OA | 88.85 | 88.52 | 98.65 | 99.06 | 93.11 | 96.15 | 99.72 | | AA | 93.58 | 93.43 | 98.17 | 99.29 | 95.35 | 97.95 | 99.43 | | Kappa | 87.55 | 87.17 | 98.50 | 98.96 | 92.31 | 95.72 | 99.69 |
|
Table 6. Classification accuracy achieved by seven different methods on Salinas dataset
| Dataset | SVM | PCA_SVM | SPCA_SVM | ERW_SVM | SE_SVM |
|---|
| Indian Pines | 42.87 | 5.74 | 10.38 | 80.82 | 15.49 | | Pavia University | 15.16 | 10.2 | 25.12 | 35.48 | 16.71 | | Salinas | 40.63 | 12.83 | 26.63 | 85.18 | 19.58 |
|
Table 7. Running time of five methods on the Indian Pines, Pavia University, and Salinas datasets