Author Affiliations
1Research Center of Laser 3D Printing Equipment and Application Engineering Technology (Liaoning Province), School of Materials Science and Engineering, Dalian University of Technology, Dalian 116024, Liaoning , China2School of Mechanical Engineering, Dalian University of Technology, Dalian 116024, Liaoning , China3Shenyang Blower Group Corporation, Shenyang 110869, Liaoning , Chinashow less
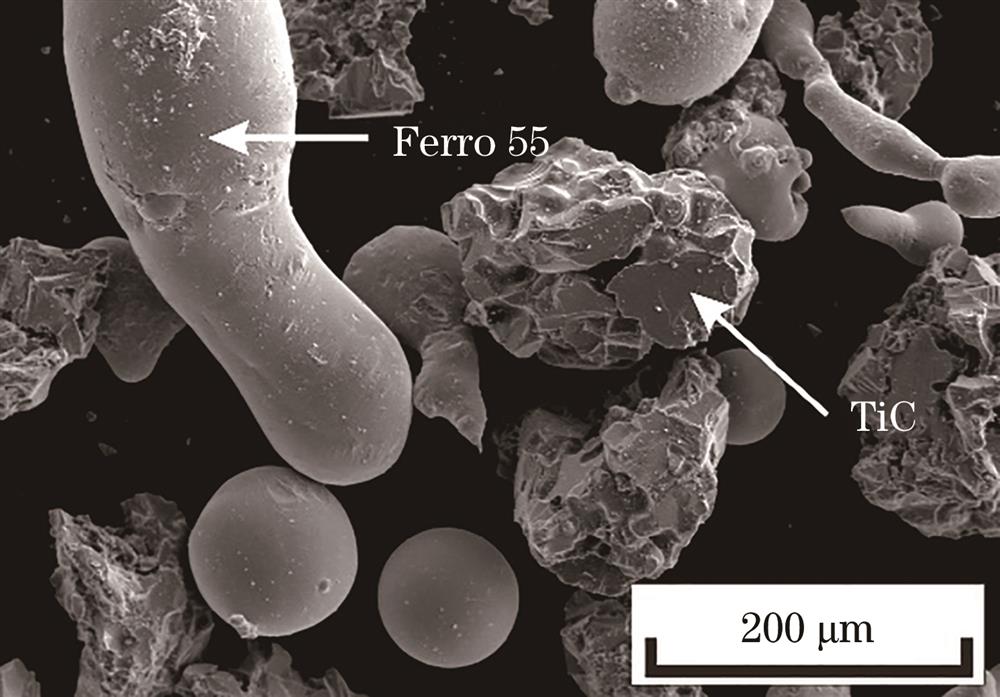
Fig. 1. Morphology of cladding powder
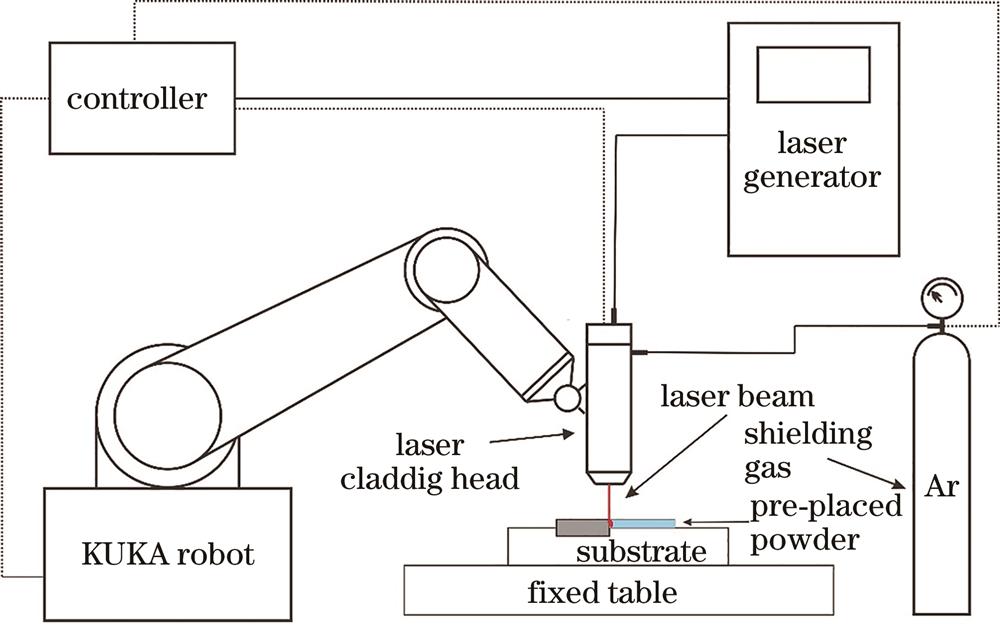
Fig. 2. Schematic diagram of laser cladding system
Fig. 3. Schematic diagram of laser cladding coating
Fig. 4. Pareto and main effects plots of dilution rates. (a) Pareto chart; (b) main effects chart
Fig. 5. Residual and main effects plots of micro hardness. (a) Pareto diagram; (b) main effect diagram
Fig. 6. Pareto and main effects plots of height. (a) Pareto chart; (b) main effects chart
Fig. 7. Pareto and main effects plots of width. (a) Pareto chart; (b) main effects chart
Fig. 8. Schematic diagram of BP neural network
Fig. 9. GA-BP neural network flow chart
Fig. 10. Comparison curves of response volume test and predicted values with coefficient of determination R2.(a) Height; (b) width; (c) dilution rate; (d) hardness
Fig. 11. Plot of predicted and expected value fit of response volume.(a) Width; (b) height; (c) dilution rate; (d) hardness
Fig. 12. Relationship between the refined process parameters and gray correlation degree
Fig. 13. Relative error of validation sample performance data for neural networks
| Material | Mass fraction /% |
|---|
| C | Mn | P | S | Si | Cr | Ni | Fe | Mo |
|---|
| 304 stainless steel | ≤0.08 | ≤2.00 | ≤0.045 | ≤0.030 | ≤1.00 | 18.0-20.0 | 8.0-11.0 | Bal. | — | | Ferro 55 | 0.35 | 1.1 | — | — | 0.3 | 7 | — | Bal. | 2 |
|
Table 1. Chemical composition of the substrate and Ferro 55 alloy powder
| Process parameter | Notation | Level |
|---|
| Laser power /W | LP | 1000 | 1200 | 1400 | 1600 | 1800 | | Scanning speed /(mm·s-1) | SS | 4 | 5 | 6 | 7 | 8 | | Flow rate of protective gas /(L·min-1) | FG | 6 | 7 | 8 | 9 | 10 |
|
Table 2. Full factor experiment level table
| No. | LP /W | SS /(mm·s-1) | FG /(L·min-1) | W /μm | H /μm | η /% | DH /HV |
|---|
| 1 | 1000 | 4 | 6 | 3775.811 | 1085.781 | 18.394 | 893.50 | | 2 | 1000 | 4 | 7 | 3839.020 | 1230.670 | 19.766 | 640.44 | | 3 | 1000 | 4 | 8 | 3653.007 | 1149.451 | 24.586 | 816.16 | | 4 | 1000 | 4 | 9 | 3749.740 | 1101.470 | 26.765 | 631.60 | | 5 | 1000 | 4 | 10 | 3843.952 | 963.0877 | 33.214 | 643.54 | | 6 | 1000 | 5 | 6 | 3620.063 | 1200.113 | 17.523 | 878.22 | | 7 | 1000 | 5 | 7 | 3589.932 | 1429.445 | 6.577 | 951.22 | | 8 | 1000 | 5 | 8 | 3632.841 | 1128.766 | 17.657 | 847.00 | | 9 | 1000 | 5 | 9 | 3633.135 | 1113.519 | 20.976 | 822.62 | | 10 | 1000 | 5 | 10 | 3395.680 | 1021.660 | 23.473 | 832.60 | | 11 | 1000 | 6 | 6 | 3378.067 | 1241.917 | 11.610 | 848.58 | | 12 | 1000 | 6 | 7 | 3380.289 | 1159.290 | 13.168 | 833.76 | | 13 | 1000 | 6 | 8 | 3549.465 | 1399.060 | 3.687 | 954.66 | | 14 | 1000 | 6 | 9 | 3596.015 | 1002.324 | 20.108 | 749.00 | | 15 | 1000 | 6 | 10 | 3431.845 | 986.5434 | 23.052 | 665.12 | | | | | | | | | | 116 | 1800 | 7 | 6 | 3983.089 | 1296.855 | 28.123 | 705.48 | | 117 | 1800 | 7 | 7 | 3904.384 | 1268.997 | 28.857 | 667.70 | | 118 | 1800 | 7 | 8 | 3624.623 | 1208.514 | 34.520 | 566.60 | | 119 | 1800 | 7 | 8 | 4292.723 | 1396.216 | 19.470 | 821.52 | | 120 | 1800 | 7 | 10 | 3374.230 | 746.500 | 46.727 | 480.96 | | 121 | 1800 | 8 | 6 | 3842.054 | 1322.708 | 24.122 | 814.26 | | 122 | 1800 | 8 | 7 | 3834.420 | 1294.360 | 21.603 | 762.53 | | 123 | 1800 | 8 | 8 | 3917.358 | 1266.675 | 26.265 | 733.98 | | 124 | 1800 | 8 | 9 | 3280.512 | 1314.897 | 24.122 | 575.80 | | 125 | 1800 | 8 | 10 | 3953.457 | 984.4884 | 31.864 | 595.90 |
|
Table 3. Morphological data and hardness data of some samples
| Source | df | Adjusted SSD | Adjusted MS | F value | P value |
|---|
| S=4.17128 R2=87.21% Adjusted R2=86.21% Predicted R2=84.98% | | Model | 9 | 13640.0 | 1515.56 | 87.10 | 0.000 | | LP | 1 | 451.4 | 451.37 | 25.94 | 0.000 | | SS | 1 | 60.6 | 60.61 | 3.48 | 0.065 | | FG | 1 | 47.6 | 47.59 | 2.74 | 0.101 | | LP×LP | 1 | 429.8 | 429.80 | 24.70 | 0.000 | | SS×SS | 1 | 47.5 | 47.50 | 2.73 | 0.101 | | FG×FG | 1 | 126.3 | 126.29 | 7.26 | 0.008 | | LP×SS | 1 | 4.7 | 4.67 | 0.27 | 0.605 | | LP×FG | 1 | 23.8 | 23.83 | 1.37 | 0.244 | | SS×FG | 1 | 64.0 | 64.01 | 3.68 | 0.058 | | Residual | 115 | 2001.0 | 17.40 | | | | Lack of fit | 114 | 1887.7 | 16.56 | 0.15 | 0.990 | | Pure error | 1 | 113.3 | 113.25 | | | | Cor total | 124 | 15641.0 | | | |
|
Table 4. Analysis of variance results for dilution rates
| Source | df | Adjusted SSD | Adjusted MS | F value | P value |
|---|
| S=94.5079 R2=63.26% Adjusted R2=60.38% Predicted R2=57.00% | | Model | 9 | 1768213 | 196468 | 22.00 | 0.000 | | LP | 1 | 64966 | 64966 | 7.27 | 0.008 | | SS | 1 | 35281 | 35281 | 3.95 | 0.049 | | FG | 1 | 0 | 0 | 0.00 | 0.998 | | LP×LP | 1 | 63104 | 63104 | 7.07 | 0.009 | | SS×SS | 1 | 32684 | 32684 | 3.66 | 0.058 | | FG×FG | 1 | 153 | 153 | 0.02 | 0.896 | | LP×SS | 1 | 768 | 768 | 0.09 | 0.770 | | LP×FG | 1 | 6929 | 6929 | 0.78 | 0.380 | | SS×FG | 1 | 40 | 40 | 0.00 | 0.947 | | Residual | 115 | 1027151 | 8932 | | | | Lack of fit | 114 | 994659 | 8725 | 0.27 | 0.944 | | Pure error | 1 | 32492 | 32492 | | | | Cor total | 124 | 2795364 | | | |
|
Table 5. Analysis of variance results for micro hardness
| Source | df | Adjusted SSD | Adjusted MS | F value | P value |
|---|
| S=99.1298 R2=49.66% Adjusted R2=45.72% Predicted R2=39.58% | | Model | 9 | 1114720 | 123858 | 12.60 | 0.000 | | LP | 1 | 12319 | 12319 | 1.25 | 0.265 | | SS | 1 | 3196 | 3196 | 0.33 | 0.570 | | FG | 1 | 95049 | 95049 | 9.67 | 0.002 | | LP×LP | 1 | 8421 | 8421 | 0.86 | 0.357 | | SS×SS | 1 | 612 | 612 | 0.06 | 0.803 | | FG×FG | 1 | 137532 | 137532 | 14.00 | 0.000 | | LP×SS | 1 | 273 | 273 | 0.03 | 0.868 | | LP×FG | 1 | 10017 | 10017 | 1.02 | 0.315 | | SS×FG | 1 | 31 | 31 | 0.00 | 0.955 | | Residual | 115 | 1130072 | 9827 | | | | Lack of fit | 114 | 1112456 | 9758 | 0.55 | 0.818 | | Pure error | 1 | 17616 | 17616 | | | | Cor total | 124 | 2244792 | | | |
|
Table 6. Analysis of variance results for height
| Source | df | Adjusted SSD | Adjusted MS | F value | P value |
|---|
| S=171.605 R2=78.09% Adjusted R2=76.38% Predicted R2=74.06% | | Model | 9 | 12073380 | 1341487 | 45.55 | 0.000 | | LP | 1 | 218954 | 218954 | 7.44 | 0.007 | | SS | 1 | 123178 | 123178 | 4.18 | 0.043 | | FG | 1 | 19186 | 19186 | 0.65 | 0.421 | | LP×LP | 1 | 33293 | 33293 | 1.13 | 0.290 | | SS×SS | 1 | 154 | 154 | 0.01 | 0.943 | | FG×FG | 1 | 6926 | 6926 | 0.24 | 0.629 | | LP×SS | 1 | 28494 | 28494 | 0.97 | 0.327 | | LP×FG | 1 | 200091 | 200091 | 6.79 | 0.010 | | SS×FG | 1 | 43861 | 43861 | 1.49 | 0.225 | | Residual | 115 | 3386568 | 29448 | | | | Lack of fit | 114 | 3163389 | 27749 | 0.12 | 0.995 | | Pure error | 1 | 223179 | 223179 | | | | Cor total | 124 | 15459948 | | | |
|
Table 7. Analysis of variance results for width
| No. | LP /W | SS /(mm·s-1) | FG /(L·min-1) | GRC |
|---|
| 1 | 1000 | 4 | 6 | 0.5455 | | 2 | 1000 | 4 | 7 | 0.4814 | | 3 | 1000 | 4 | 8 | 0.5468 | | 4 | 1000 | 4 | 9 | 0.5495 | | 5 | 1000 | 4 | 10 | 0.5891 | | 6 | 1000 | 5 | 6 | 0.5075 | | 7 | 1000 | 5 | 7 | 0.4698 | | 8 | 1000 | 5 | 8 | 0.5105 | | 9 | 1000 | 5 | 9 | 0.5254 | | 10 | 1000 | 5 | 10 | 0.5506 | | 11 | 1000 | 6 | 6 | 0.4564 | | 12 | 1000 | 6 | 7 | 0.4691 | | 13 | 1000 | 6 | 8 | 0.4647 | | 14 | 1000 | 6 | 9 | 0.5239 | | 15 | 1000 | 6 | 10 | 0.5242 | | | | | | | 25 | 1000 | 8 | 10 | 0.3947 | | | | | | | 106 | 1800 | 4 | 6 | 0.6250 | | | | | | | 116 | 1800 | 7 | 6 | 0.5705 | | 117 | 1800 | 7 | 7 | 0.5704 | | 118 | 1800 | 7 | 8 | 0.5028 | | 119 | 1800 | 7 | 8 | 0.5482 | | 120 | 1800 | 7 | 10 | 0.5502 | | 121 | 1800 | 8 | 6 | 0.5344 | | 122 | 1800 | 8 | 7 | 0.5060 | | 123 | 1800 | 8 | 8 | 0.5505 | | 124 | 1800 | 8 | 9 | 0.4607 | | 125 | 1800 | 8 | 10 | 0.6033 |
|
Table 8. Gray correlation degree of some samples
| Process parameter | Parameter range | Upward gradient | Number of levels |
|---|
| LP /W | 1000-1800 | 10 | 81 | | SS /(mm·s-1) | 4-8 | 0.1 | 41 | | FG /(L·min-1) | 6-10 | 0.5 | 9 |
|
Table 9. Parameter level design
| Sample number | LP /W | SS /(mm·s-1) | FG /(L·min-1) |
|---|
| T1 | 1370 | 5.0 | 7.5 | | T2 | 1410 | 6.5 | 8.0 | | T3 | 1060 | 6.2 | 6.0 | | T4 | 1700 | 7.5 | 9.0 | | T5 | 1500 | 4.0 | 7.0 | | H1 | 1090 | 4.4 | 10.0 | | H2 | 1090 | 4.4 | 10.0 | | H3 | 1090 | 4.4 | 10.0 |
|
Table 10. Sample parameters for validation
| Sample | W /μm | H /μm | η /% | DH /HV |
|---|
| T1 | 3882.1 | 1287.5 | 24.069 | 715.30 | | T1′ | 3993.5 | 1234.3 | 30.000 | 602.05 | | T2 | 3885.3 | 1301.9 | 21.143 | 754.24 | | T2′ | 3723.9 | 1198.0 | 25.800 | 707.74 | | T3 | 3405.7 | 1299.4 | 12.671 | 772.44 | | T3′ | 3504.1 | 1277.9 | 12.732 | 905.74 | | T4 | 3907.8 | 1259.2 | 27.893 | 660.16 | | T4′ | 3771.5 | 1200.0 | 32.221 | 610.27 | | T5 | 4129.7 | 1191.8 | 32.907 | 529.98 | | T5′ | 4225.3 | 1209.1 | 38.730 | 535.17 |
|
Table 11. Test and predicted values of the validated samples by neural networks
| Sample | W /μm | H /μm | η /% | DH /HV | GRC |
|---|
| H1 | 3715.3 | 1112.5 | 32.564 | 518.72 | 0.5448 | | H2 | 3459.6 | 925.1 | 41.638 | 530.90 | 0.5668 | | H3 | 3666.2 | 1030.9 | 35.639 | 525.47 | 0.5403 | | H’ | 3714.2 | 967.4 | 29.972 | 611.42 | 0.6797 |
|
Table 12. Test and predicted values of the validated samples by neural networks