 AI Video Guide
  AI Picture Guide
 AI One Sentence

Fan Wang, Siyu Lin, Yanchen Qu, Xiaopeng Han, Yundong Zhang, "Integrated Fabry–Perot interferometer based on Er/Yb co-doped fiber for all-optical phase modulation," Chin. Opt. Lett. 22, 041901 (2024)
- Chinese Optics Letters
- Vol. 22, Issue 4, 041901 (2024)
Note: This section is automatically generated by AI . The website and platform operators shall not be liable for any commercial or legal consequences arising from your use of AI generated content on this website. Please be aware of this.
Abstract
1. Introduction
The phase modulator is one of the most indispensable devices in the optical field that is used to control the phase of light by an external signal, and it has important applications in laser, sensing, and quantum[1–3]. To enable better compatibility of devices with the typical fiber-optic systems, all-fiber phase modulators with low cost and low insertion loss have been widely studied by researchers. At present, the schemes based on all-fiber phase modulation mainly include electro-optical modulation[4] and all-optical modulation[5]. Compared with the former, the latter has the advantages of low transmission loss, large operating bandwidth as well as fast response speed[6]. Moreover, benefiting from the high photo-thermal coefficients of two-dimensional (2D) materials, such as graphene[7–9], MXene[10,11], and tungsten disulfide (
Because of its simple fabrication and stability, fiber in-line interferometers are widely applied in the fields of fiber sensors and optical filters[13–15]. Similarly, it also provides an excellent platform for all-optical modulation. Chu et al. reported an all-optical phase shifter based on graphene and a twin-core fiber MI and achieved an optical switching with a response time of 55.8 ms[16]. Yi et al. proposed an all-optical phase modulator by combining MXene with a compact in-line MZI and greatly improved the sensitivity of the phase modulator using polydimethylsiloxane[17]. However, the 2D materials need to be deposited on the surface of the fiber in the above schemes. Thus, not only does the fabrication of the device require a complex process but the materials located on the surface of the fiber are susceptible to external pollution, which means the device in practical applications will face the challenge of maintaining long-term environmental stability. For comparison, the fiber doped with rare-earth ions has a high photo-thermal coefficient and good environmental stability[18]. In previous research, we achieved all-optical phase modulation by combining Er/Yb co-doped fiber (EYDF) and in-line Fabry–Perot interferometer (FPI), and the proposed device is simple to fabricate, compact, and has long-term environmental stability. However, limited by the thermal response of the EYDF, the modulation speed of the device is relatively slow (
In this Letter, we propose a scheme to achieve all-optical phase modulation using a compact fiber in-line FPI platform as well as the nonlinear and thermo-optic effects in EYDF. Compared with Ref. [19], the proposed device is further improved in its structure, in which the reflective FPI is fabricated by splicing the hollow-core fiber (HCF) and EYDF. In particular, the EYDF is set as an F-P cavity, which not only greatly improves the sensitivity of the phase modulation, but also introduces a nonlinear phase shift to the F-P cavity, enabling the device to achieve all-optical phase modulation at a high frequency. This scheme has the advantages of compact structure, simple fabrication, and good stability, providing an avenue to all-optical phase modulation in all-fiber systems.
Sign up for Chinese Optics Letters TOC. Get the latest issue of Chinese Optics Letters delivered right to you!Sign up now
2. Device Fabrication and Principle
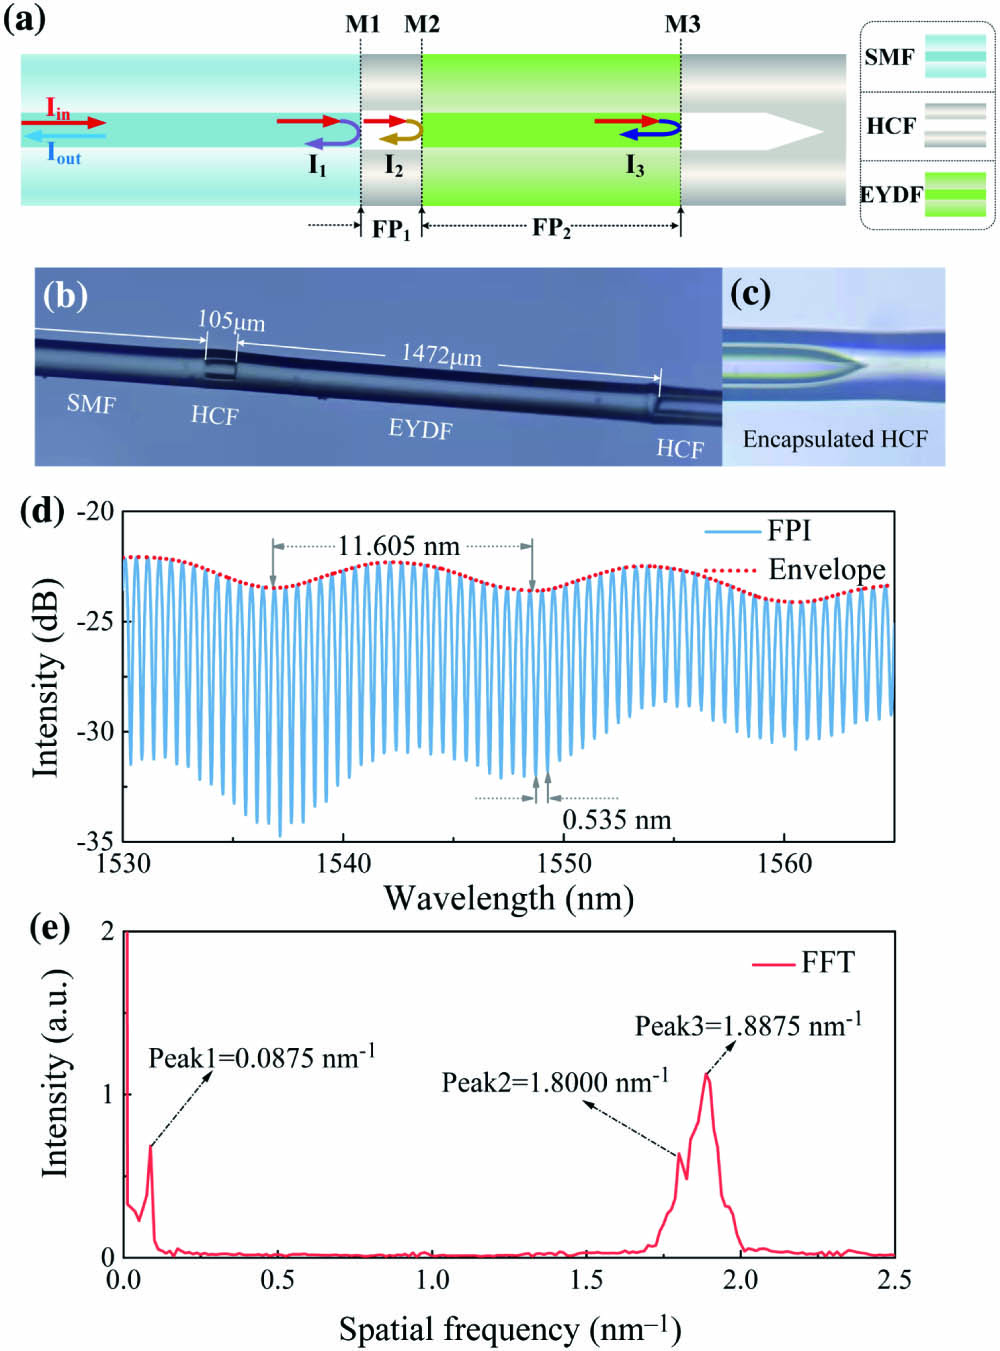
The schematic diagram of the EYDF-based reflective FPI is shown in Fig. 1(a). The FPI of the all-fiber structure is made by splicing commercial fibers using a fusion splicer (FSM-45PM, Fujikura) and a fiber cleaver. To enable the EYDF so that it can be used as an F-P cavity, we add a short HCF at the front of the EYDF to form a reflective surface for the EYDF, which is fabricated as follows. First, the input single-mode fiber (SMF) is fused to a short HCF using a fusion splicer, which creates a mirror surface (M1) at the splice because the refractive index (RI) of the SMF core is greater than that of the HCF core (air). Subsequently, a section of EYDF is fused to the SMF-HCF cascade structure, also due to the difference in the RI between the EYDF core and the air, and two mirror surfaces are formed at the ends of the EYDF, namely M2 and M3. Finally, the FPI is encapsulated using a section of the HCF. As shown in Fig. 1(c), a tapered structure is formed at the end of the HCF by discharging to prevent M3 from being polluted from the external environment. Figure 1(b) illustrates the micrographs of the fabricated FPI, where the lengths of the HCF and the EYDF are 105 µm and 1472 µm, respectively.
![]()
Figure 1.(a) Schematic diagram of the EYDF-based reflective FPI. The micrographs of (b) the FPI and (c) the end of the HCF used for encapsulation. (d) Measured reflected spectrum of the FPI. The dotted curve is the spectral envelope. (e) Spatial frequency spectrum of the FPI.
The whole FPI has two F-P cavities, and the reflected spectrum is produced by three-beam optical interference. The reflected light of the FPI can be written as
3. Experimental Results and Discussion
Figure 2(a) shows the experimental setup diagram for the dynamic phase tuning of the EYDF-based FPI. The input light comes from a broadband light source (BLS) or tunable laser source (TLS), in which the BLS is used to measure the reflected spectrum of the FPI, and the TLS is used to measure the modulation response. To dynamically tune the phase shift in the FPI, a laser with a central wavelength of 973 nm and controllable optical power is used for the pump, which passes through the wavelength division multiplexer (WDM) along with the signal light and then enters the FPI. Moreover, in order to measure the response speed of the device during the modulation process, the pump light is modulated into a pulse sequence by the electro-optic modulator (EOM) and the arbitrary waveform generator (AWG). Finally, the reflected light of the FPI is monitored by an optical spectrum analyzer (OSA, Anritsu CMA5000) or detected by a photodetector (PD) and a digital storage oscilloscope (DSO) after passing through the circulator (CIRC). Figure 2(b) is a photograph of the fabricated FPI excited by the pump light. The EYDF emits green fluorescence under the excitation of 973 nm optical pumping.
![]()
Figure 2.(a) Diagram of the experimental setup. C1 and C2, optical coupler. (b) Photograph of the FPI under pump light excitation.
In the experiment, we first investigate the relationship between the FPI spectra and pump light by using BLS and OSA. Figure 3(a) gives the reflected spectra at different pump powers, where the solid lines are the interference fringes and the dotted lines are the envelopes of the interference spectra. Figure 3(b) shows the envelopes at different pump powers, and it can be seen that there is no significant wavelength shift in the envelopes with the increase of the pump power, indicating that the temperature change induced by the pump has minimal effect on the phase of the air cavity. However, the fine interference fringes shift to longer wavelengths with increasing pump power, and the maximum shift of the wavelength dip at a pump power of 120 mW is 1.005 nm, as shown in Fig. 3(c). As the pump light is switched off, the spectrum will also return to its initial position. During the modulation process, only the extinction ratio (ER) of the interference fringes has a change of 1.42 dB (from 11.27 dB at 0 mW to 9.85 dB at 120 mW), while there is no significant change in the FSR and the spectral lineshape, suggesting that the device has a good stability. According to the above theory, the interference spectrum shift is caused by the phase change in the EYDF. Thus, the corresponding phase change can be calculated from the shift of the wavelength dip, which can be expressed as
![]()
Figure 3.(a) The evolution of the reflected spectra of the FPI as the pump power increases. (b) The spectral envelope at different pump powers. (c) The partial magnification of the measured reflected spectra. (d) The phase shift at different pump powers.
Subsequently, we explore the temporal response of the device during modulation. From Fig. 3(c), we know that the spectrum will red shift with increasing pump power. Therefore, when the input light is a narrow linewidth continuous wave (CW) and the center wavelength is located near the spectral dip, the center wavelength will move towards the spectral peak as the pump power increases, which results in the output light intensity of the FPI also being modulated by the pump light, from weak to strong. In the experiment, we set the output wavelength of the TLS to 1537.1300 nm, and the 973-nm pump is modulated into a periodic square wave. When the modulation frequency is 1 Hz, the CW signal is successfully modulated by the pump light into a pulsed light with a corresponding period, as shown in Fig. 4(a). The response time of the modulation is 204 ms, which is obtained by observing the time needed for the voltage to rise from 10% to 90%. This low-speed thermal modulation can be used in some applications that do not require high modulation speed, such as tunable optical filters.
![]()
Figure 4.Output signal waveforms at different modulation frequencies. (a) 1 Hz with a temporal response of 204 ms. (b) 100 Hz with a temporal response of 2.5 ms.
Since the EYDF acts as a cavity for the FPI, the intensity change of the optical signal at 1 Hz is caused by the thermal phase shift of the thermo-optic effect and the nonlinear phase shift of the electronic effect. The generation of the nonlinear phase shift is due to the doped rare-earth ions showing a strong absorption band in the spectrum, while the input pump light will change the absorption of the rare-earth ions by partially depleting its ground state. Based on the Kramers–Kronig (K-K) causality, the RI of the fiber will change accordingly. Compared to the thermal phase shift, the nonlinear phase shift has a fast response speed, which depends on the substable lifetime of the rare-earth ions in the fiber. Therefore, the thermal phase shift will be averagely cancelled out at a high modulation frequency, leaving only the nonlinear phase shift[20]. Figure 4(b) presents the output waveform at a modulation frequency of 100 Hz, where the continuous signal light is likewise modulated into a pulsed signal. The measured response speed of the modulation is 2.5 ms, which is 2 orders of magnitude faster than the thermal phase shift. However, the peak-to-peak voltage of its pulses is only about 2.5 mV, compared to 50 mV for a pulse at 1 Hz, indicating the phase change induced by thermo-optic and electronic effects is about 1:19.
To better illustrate the transition from thermal to nonlinear phase shift, the output signal waveforms at modulation frequencies of 5 Hz, 10 Hz, and 50 Hz are given in Fig. 5. It can be clearly seen that when the modulation frequency is increased from 1 Hz to 10 Hz, the signal waveform gradually changes from a square to a triangle due to the hysteresis of thermal conduction and diffusion, accompanied by a gradual decrease in the peak voltage. Note that the thermal-optic effect (i.e., thermal phase shift) is still dominant in this state, and its response time is independent of the modulation frequency, which depends mainly on the material and structural properties of the EYDF. As the modulation frequency is increased to 50 Hz, the output signal changes from a triangular wave to a square-like wave, the thermal phase shift decreases, and the nonlinear phase shift dominates. However, limited by the length of the EYDF and the concentration of the doped rare-earth ions (the peak cladding absorption coefficient at 915 nm is 3.03 dB/m), the modulation sensitivity of the nonlinear phase shift is still relatively low. In addition, as shown in Fig. 4(a), the presence of the thermal phase shift also results in a slow temporal response at a low modulation frequency. Indeed, further increasing the concentration of rare-earth ions in fiber can solve the above problems. For example, Janos et al. obtained nonlinear phase shift of
![]()
Figure 5.Output signal waveforms at modulation frequencies of 5 Hz, 10 Hz, and 50 Hz.
Table 1 summarizes the research state of the all-optical modulators with different structures and materials. It can be seen that the proposed modulators perform relatively well in terms of modulation sensitivity and temporal response. However, compared with modulation schemes based on MI or MZI, the proposed all-optical modulator is more compact and has the advantages of excellent stability[5,12,16,22]. In addition, the modulator requires only a simple splicing of commercial fibers, which makes it simpler and more robust in construction than the MKR[10]. In particular, the scheme does not require the 2D material to be coated on the surface of the fiber, leading to a good environmental stability of the proposed modulator.
| Structure | Materials | Modulation Sensitivity (π/mW) | Temporal Response (ms) | Ref. |
|---|---|---|---|---|
| MZI | Graphene | 0.091 | 4 | [ |
| MZI | WS2 | 0.0174 | 7.3 | [ |
| MI | Graphene | 0.0102 | 55.8 | [ |
| MI | MXene Ti3C2Tx | 0.043 | 5.3 | [ |
| MKR | MXene Ti2CTx | 0.196 | 0.306 | [ |
| FPI | Er/Yb co-doped fiber | 0.0167 | 221 | [ |
| FPI | Er/Yb co-doped fiber | 0.0312 | 2.5 | This work |
Table 1. Comparison of the Proposed Modulator with Previously Demonstrated All-Optical Modulators
To verify that the fabricated device has good environmental stability, we placed the encapsulated FPI in a mixture of water and glycerol with different concentrations. The RI of the mixed solutions is calibrated using an Abbe refractometer with a resolution of
![]()
Figure 6.Measured reflected spectra of the FPI at different RIs. The inset is the partial magnification near the wavelength of 1537 nm.
4. Conclusion
In summary, we have presented an all-optical phase modulation scheme based on an EYDF and in-line FPI. The proposed device is an all-fiber structure, fabricated by splicing commercial fibers HCF and EYDF. Benefiting from the rational design of the EYDF as an F-P cavity, the modulator introduces both a nonlinear and a thermal phase shift. The maximum tunable phase shift is
References


Set citation alerts for the article
Please enter your email address

© Copyright 2018-2021 | Chinese Laser Press. All Rights Reserved 沪ICP备15018463号-20