• Chinese Optics Letters
  • Vol. 22, Issue 4, 041901 (2024)
Fan Wang, Siyu Lin, Yanchen Qu, Xiaopeng Han, and Yundong Zhang*
Author Affiliations
  • National Key Laboratory of Tunable Laser Technology, Institute of Opto-Electronics, Harbin Institute of Technology, Harbin 150080, China
  • show less
    DOI: 10.3788/COL202422.041901 Cite this Article Set citation alerts
    Fan Wang, Siyu Lin, Yanchen Qu, Xiaopeng Han, Yundong Zhang, "Integrated Fabry–Perot interferometer based on Er/Yb co-doped fiber for all-optical phase modulation," Chin. Opt. Lett. 22, 041901 (2024) Copy Citation Text show less
    (a) Schematic diagram of the EYDF-based reflective FPI. The micrographs of (b) the FPI and (c) the end of the HCF used for encapsulation. (d) Measured reflected spectrum of the FPI. The dotted curve is the spectral envelope. (e) Spatial frequency spectrum of the FPI.
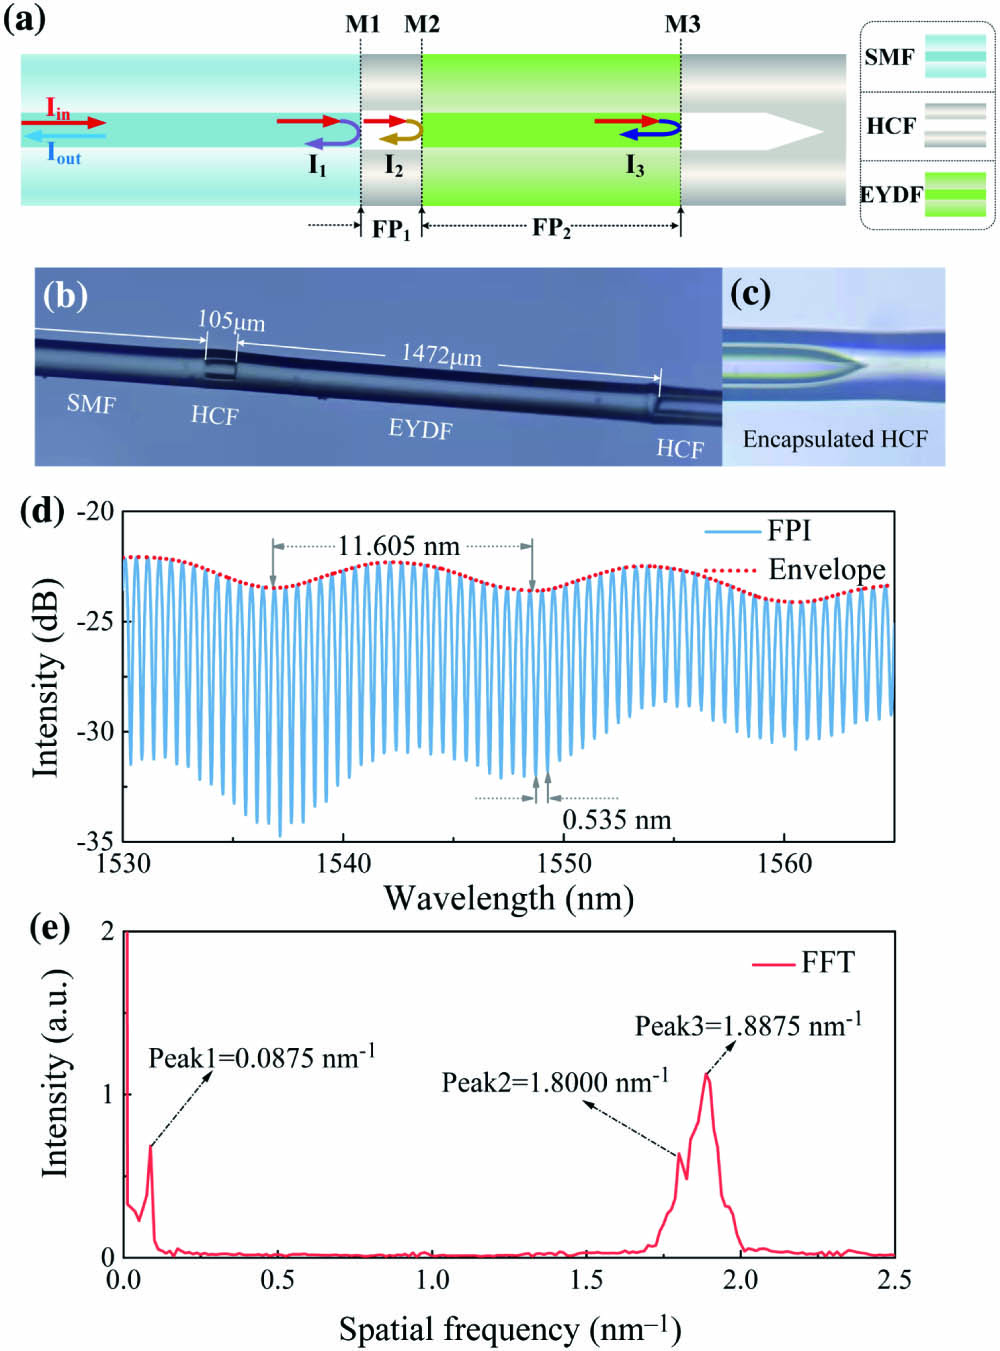
    Fig. 1. (a) Schematic diagram of the EYDF-based reflective FPI. The micrographs of (b) the FPI and (c) the end of the HCF used for encapsulation. (d) Measured reflected spectrum of the FPI. The dotted curve is the spectral envelope. (e) Spatial frequency spectrum of the FPI.
    (a) Diagram of the experimental setup. C1 and C2, optical coupler. (b) Photograph of the FPI under pump light excitation.
    Fig. 2. (a) Diagram of the experimental setup. C1 and C2, optical coupler. (b) Photograph of the FPI under pump light excitation.
    (a) The evolution of the reflected spectra of the FPI as the pump power increases. (b) The spectral envelope at different pump powers. (c) The partial magnification of the measured reflected spectra. (d) The phase shift at different pump powers.
    Fig. 3. (a) The evolution of the reflected spectra of the FPI as the pump power increases. (b) The spectral envelope at different pump powers. (c) The partial magnification of the measured reflected spectra. (d) The phase shift at different pump powers.
    Output signal waveforms at different modulation frequencies. (a) 1 Hz with a temporal response of 204 ms. (b) 100 Hz with a temporal response of 2.5 ms.
    Fig. 4. Output signal waveforms at different modulation frequencies. (a) 1 Hz with a temporal response of 204 ms. (b) 100 Hz with a temporal response of 2.5 ms.
    Output signal waveforms at modulation frequencies of 5 Hz, 10 Hz, and 50 Hz.
    Fig. 5. Output signal waveforms at modulation frequencies of 5 Hz, 10 Hz, and 50 Hz.
    Measured reflected spectra of the FPI at different RIs. The inset is the partial magnification near the wavelength of 1537 nm.
    Fig. 6. Measured reflected spectra of the FPI at different RIs. The inset is the partial magnification near the wavelength of 1537 nm.
    StructureMaterialsModulation Sensitivity (π/mW)Temporal Response (ms)Ref.
    MZIGraphene0.0914[5]
    MZIWS20.01747.3[12]
    MIGraphene0.010255.8[16]
    MIMXene Ti3C2Tx0.0435.3[22]
    MKRMXene Ti2CTx0.1960.306[10]
    FPIEr/Yb co-doped fiber0.0167221[19]
    FPIEr/Yb co-doped fiber0.03122.5This work
    Table 1. Comparison of the Proposed Modulator with Previously Demonstrated All-Optical Modulators
    Fan Wang, Siyu Lin, Yanchen Qu, Xiaopeng Han, Yundong Zhang, "Integrated Fabry–Perot interferometer based on Er/Yb co-doped fiber for all-optical phase modulation," Chin. Opt. Lett. 22, 041901 (2024)
    Download Citation