• Laser & Optoelectronics Progress
  • Vol. 60, Issue 11, 1106025 (2023)
Qian Chen, Qiang Wu*, Bin Liu**, Juan Liu..., Yingying Hu and Xingdao He|Show fewer author(s)
Author Affiliations
  • Key Laboratory of Nondestructive Testing (Ministry of Education), Nanchang Hangkong University, Nanchang 330063, Jiangxi, China
  • show less
    DOI: 10.3788/LOP230702 Cite this Article Set citation alerts
    Qian Chen, Qiang Wu, Bin Liu, Juan Liu, Yingying Hu, Xingdao He. Study on Determination of Lead Ion Concentration by Chelating Agent Modified Tapered Fiber Optic Sensor[J]. Laser & Optoelectronics Progress, 2023, 60(11): 1106025 Copy Citation Text show less
    Schematic diagram of micro-nano fiber sensor
    Fig. 1. Schematic diagram of micro-nano fiber sensor
    Schematic diagram of optical fiber tapering system
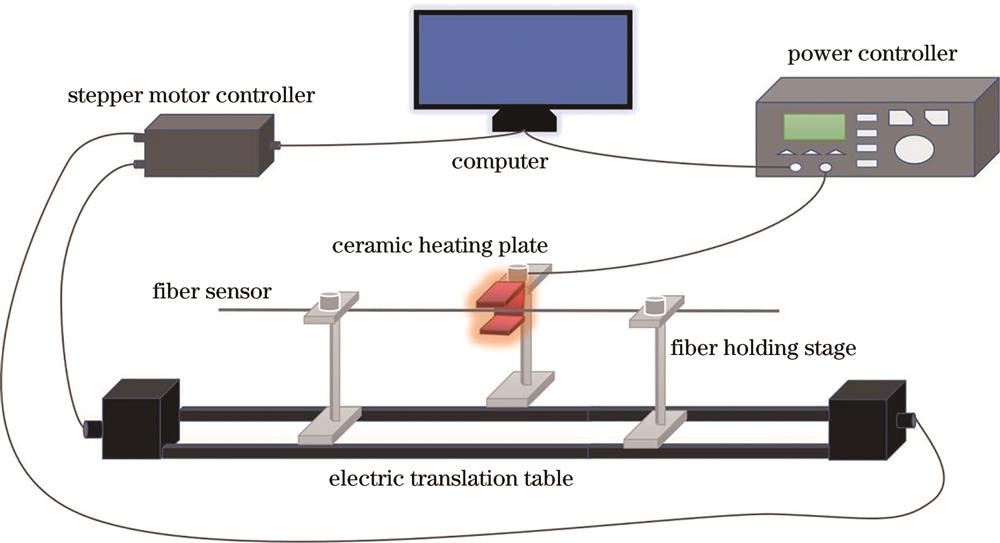
    Fig. 2. Schematic diagram of optical fiber tapering system
    Schematic diagram of fiber surface functionalization. (a) Hydroxyl group is produced by KOH solution treatment; (b) treatment with silanizing reagents to produce carboxyl groups; (c) immobilization of the EDTA on surface of optical fiber sensor; (d) functionalized fiber optic sensor
    Fig. 3. Schematic diagram of fiber surface functionalization. (a) Hydroxyl group is produced by KOH solution treatment; (b) treatment with silanizing reagents to produce carboxyl groups; (c) immobilization of the EDTA on surface of optical fiber sensor; (d) functionalized fiber optic sensor
    Schematic diagram of the experimental setup
    Fig. 4. Schematic diagram of the experimental setup
    Refractive index sensitivity diagram of the sensor. (a) Spectra of the sensor S1 near refractive index 1.33; (b) relationship between wavelength shift and refractive index of sensor S1, S2, and S3
    Fig. 5. Refractive index sensitivity diagram of the sensor. (a) Spectra of the sensor S1 near refractive index 1.33; (b) relationship between wavelength shift and refractive index of sensor S1, S2, and S3
    Temperature characteristics. (a) Spectral response of the sensor in the temperature range of 30-50 ℃; (b) linear relationship between sensor wavelength change and temperature change
    Fig. 6. Temperature characteristics. (a) Spectral response of the sensor in the temperature range of 30-50 ℃; (b) linear relationship between sensor wavelength change and temperature change
    Experimental results. (a) Spectral response of sensors in deionized water over time; (b) drift of sensors in deionized water for 15 min; (c) relationship curve between wavelength shift and Pb2+ concentration; (d) spectral response over time when the sensor was immersed in Pb2+(100 ng/mL) solution; (e) spectral drift of sensors immersed in different Pb2+ solution concentrations over time
    Fig. 7. Experimental results. (a) Spectral response of sensors in deionized water over time; (b) drift of sensors in deionized water for 15 min; (c) relationship curve between wavelength shift and Pb2+ concentration; (d) spectral response over time when the sensor was immersed in Pb2+(100 ng/mL) solution; (e) spectral drift of sensors immersed in different Pb2+ solution concentrations over time
    Concentration of Pb2+ /(ng·mL-1Wavelength shift /nm
    10.2347
    100.4476
    1000.6069
    1×1030.9822
    Table 1. Drift corresponding to different mass concentrations of lead ion solutions
    Qian Chen, Qiang Wu, Bin Liu, Juan Liu, Yingying Hu, Xingdao He. Study on Determination of Lead Ion Concentration by Chelating Agent Modified Tapered Fiber Optic Sensor[J]. Laser & Optoelectronics Progress, 2023, 60(11): 1106025
    Download Citation