
Da Xu, Jun Pan, Lijun Jiang, Yu Cao. Typical Feature Classification and Identification Method Based on Hyperspectral Data[J]. Laser & Optoelectronics Progress, 2023, 60(15): 1530002
- Laser & Optoelectronics Progress
- Vol. 60, Issue 15, 1530002 (2023)
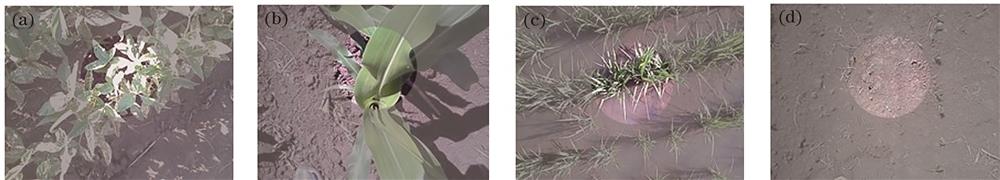
Fig. 1. Surface states of four types of features. (a) Soybean; (b) corn; (c) rice; (d) bare soil
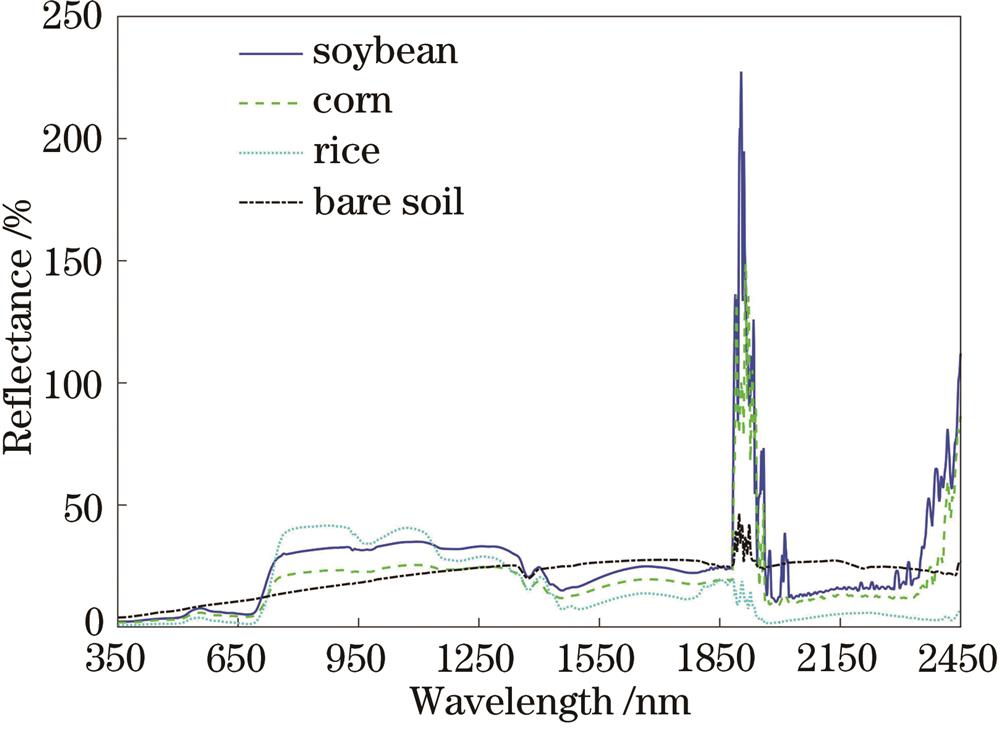
Fig. 2. Average reflectance spectral curves of four types of features in the range of 350-2500 nm
Fig. 3. Spectral curves of some samples of four types of features from 350-1800 nm (20 bars). (a) Soybean; (b) corn; (c) rice; (d) bare soil
Fig. 4. SPA feature band selection results. (a) RMSE; (b) average spectral reflectance
Fig. 5. Distribution of feature sample points. (a) 410 nm and 542 nm; (b) 410 nm and 714 nm; (c) 410 nm and 856 nm; (d) 410 nm and 1423 nm; (e) 410 nm and 1475 nm; (f) 410 nm and 1712 nm
Fig. 6. Structure diagrams. (a) 1DCNN; (b) 1DCNN-SPA
Fig. 7. 1DCNN model training results. (a) Loss; (b) classification accuracy
Fig. 8. 1DCNN-SPA model training results. (a) Loss; (b) classification accuracy
Fig. 9. LSTM architecture
Fig. 10. Structure diagrams. (a) LSTM; (b) LSTM-SPA
Fig. 11. LSTM model training results. (a) Loss; (b) classification accuracy
Fig. 12. LSTM-SPA model training results. (a) Loss; (b) classification accuracy
Fig. 13. Overall classification accuracy of different models with different wave sets
Fig. 14. Different model accuracy metrics
Fig. 15. Confusion matrix for different model classifications. (a) BP; (b) KNN; (c) 1DCNN; (d) LSTM
Fig. 16. BP Spectral curves. (a) Soybeans classified correctly, soybeans misclassified into corn samples; (b) corns classified correctly, soybeans misclassified into corn samples
Fig. 17. KNN Spectral curves. (a) Corns classified correctly, corns misclassified into soybean samples; (b) soybeans classified correctly, corns misclassified into soybean samples
Fig. 18. Comparison of soybean misclassification into corn samples at different stages of BP with correct soybean and corn classification samples.(a) Stage 1(16); (b) stage 2(11); (c) stage 3(6); (d) stage 4(5)
Fig. 19. Comparison of corn misclassification into soybean samples at different stages of KNN with correct corn and soybean classification samples(No change in the fourth stage).(a) Stage 1(8); (b) stage 2(6); (c) stage 3(3)
Fig. 20. Overall classification accuracy of soybean and corn for four methods under different stage feature band sets
|
Table 1. Data set statistics
|
Table 2. Classification results of different models
|
Table 3. Classification results of different models
|
Table 4. Overall classification accuracy of different models with different sets of bands
| |||||||||||||||||||||||||||||||||||||||||||||||||||||||||||||||
Table 5. Classification accuracy of various types of features under 8 feature bands of different models


Set citation alerts for the article
Please enter your email address

© Copyright 2018-2021 | Chinese Laser Press. All Rights Reserved 沪ICP备15018463号-20