
Danqing Liu, Changlei Guo, Chunzhao Ma, Weitong Fan, Xuezhen Gong, Zhen Zhang, Wenxun Li, Jie Xu, Kui Liu, Hsien-Chi Yeh, "All-solid-state miniature laser gyroscope based on a single monolithic non-planar ring oscillator," Photonics Res. 13, 897 (2025)
- Photonics Research
- Vol. 13, Issue 4, 897 (2025)
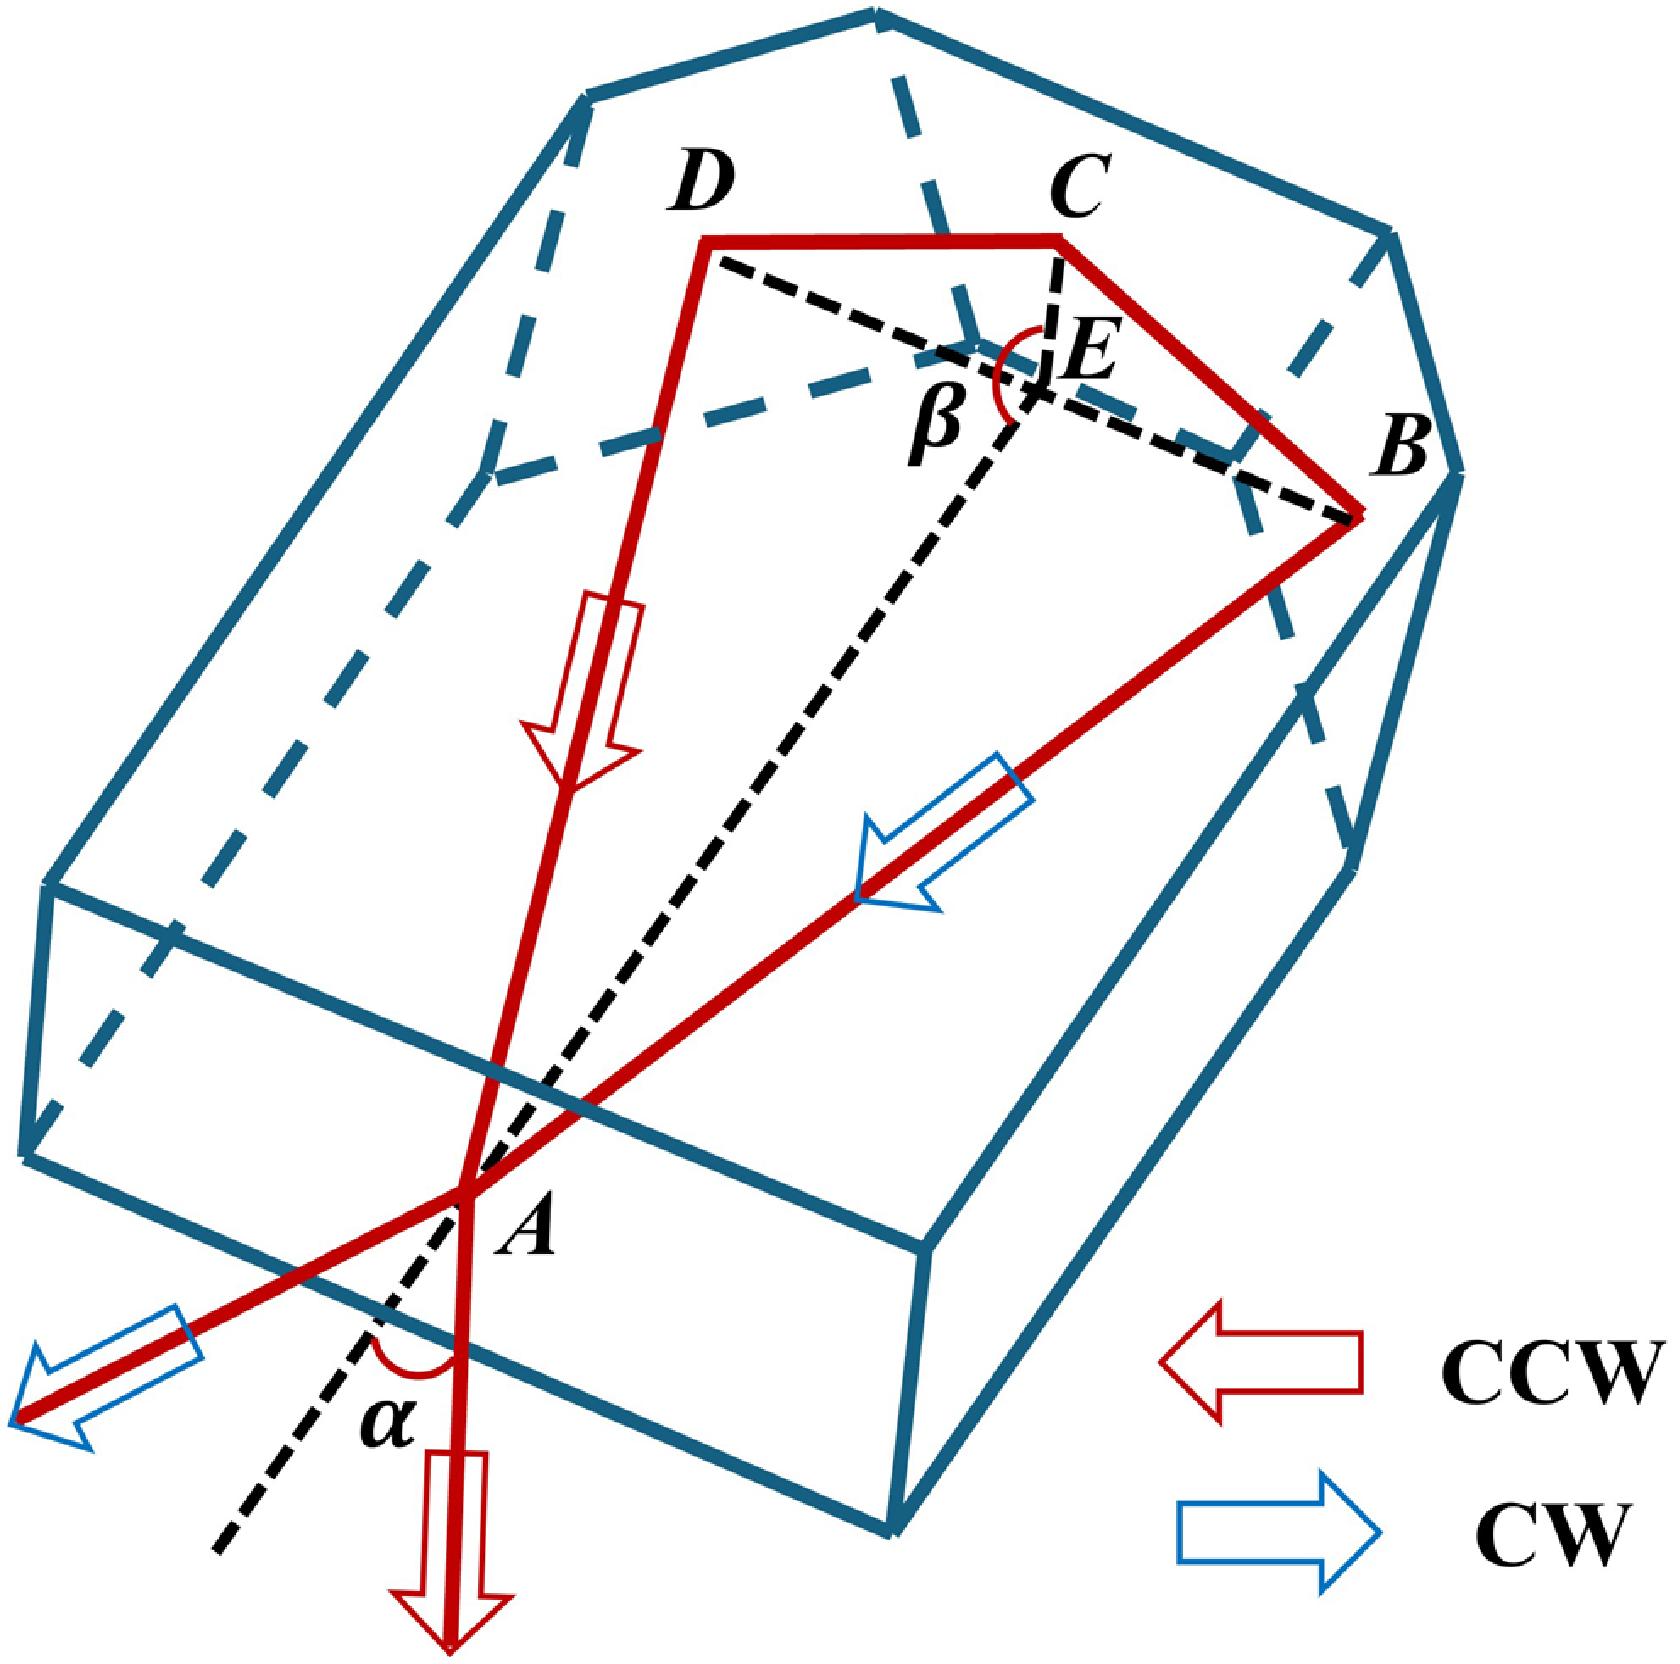
Fig. 1. A typical NPRO geometry and its internal light paths. A B C D E B D α β

Fig. 2. (a) Schematic of the experimental setup for NPRO gyroscope. LD, laser diode; CM, collimator; DM, dichroic mirror; TEC, thermoelectric cooler; Att, optical attenuator; PD, photodetector. The current supply, temperature controllers, and electronics used for signal amplifying and filtering are not shown. (b) Spectrum of a typical beat signal at 346 kHz measured with resolution bandwidth (RBW) of 100 Hz.
Fig. 3. (a) Scheme of measuring wavefront distortion in NPRO; (b), (c) wavefront distortions measured with two different NPRO samples. The RMS and PV values are given.
Fig. 4. Beat frequency noise comparison between beat signals from low-distortion (beat frequency at 328 kHz) and high-distortion (beat frequency at 334 kHz) NPRO samples.
Fig. 5. NPRO gyroscope beat frequency shift with different rotational speeds. The offset frequency is at 334 kHz.
Fig. 6. Allan deviation of the NPRO gyroscope beat frequency.
Fig. 7. Noise investigations for the NPRO gyroscope. Red: beat frequency noise of the NPRO gyroscope in steady state; blue: magnetic noise measured with magnet in nominal position around the NPRO; gray: magnetic background noise measured when the magnet is removed; brown: NPRO temperature noise; green: pump power noise.
Fig. 8. (a) A conceptual package design of NPRO gyroscope with all optics and basic electronics. The body dimension of the package is 30 mm × 25 mm × 11 mm 3 mm × 13 mm × 15 mm 6 ). The black dashed line marks the Earth rotation speed; the blue and red points represent the bias instability achieved in the present experiment and the projected bias instability using the new NPRO sample under design, respectively.
Fig. 9. Modulation coefficient measurement results. (a) Beat frequency versus pump power; (b) beat frequency versus NPRO temperature; (c) beat frequency versus magnetic intensity. Red squares: measurements; black solid lines: linear fitting. The slopes and coefficients of determination R 2
|
Table 1. NPRO Parameters in Experiment and under Design


Set citation alerts for the article
Please enter your email address

© Copyright 2018-2021 | Chinese Laser Press. All Rights Reserved 沪ICP备15018463号-20