
Yang Rui, Liang Zhang, Chunyang Duan, Pengyue Liu, Shichuan Yu, Yuelong Wu, Haibin Wu. Realization of the 6Li Cold Atom Interferometer and Precise Measurement of Recoil Frequency[J]. Laser & Optoelectronics Progress, 2023, 60(11): 1106019
- Laser & Optoelectronics Progress
- Vol. 60, Issue 11, 1106019 (2023)
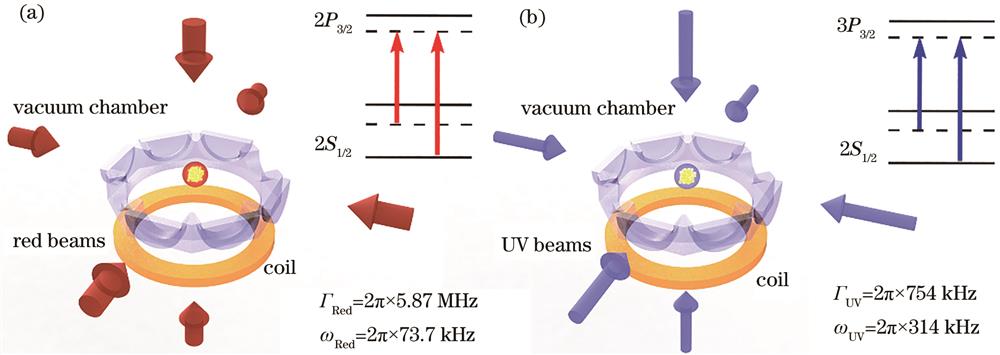
Fig. 1. Diagram of preparation of low-temperature atom sample. (a) The 671 nm MOT and the energy level of 2S-2P transition; (b) the 323 nm MOT and the energy level of 2S-3P transition. The atoms are successively trapped by 671 nm MOT and 323 nm MOT, and the 6×10⁷ atoms are obtained at the temperature of 40 μK finally
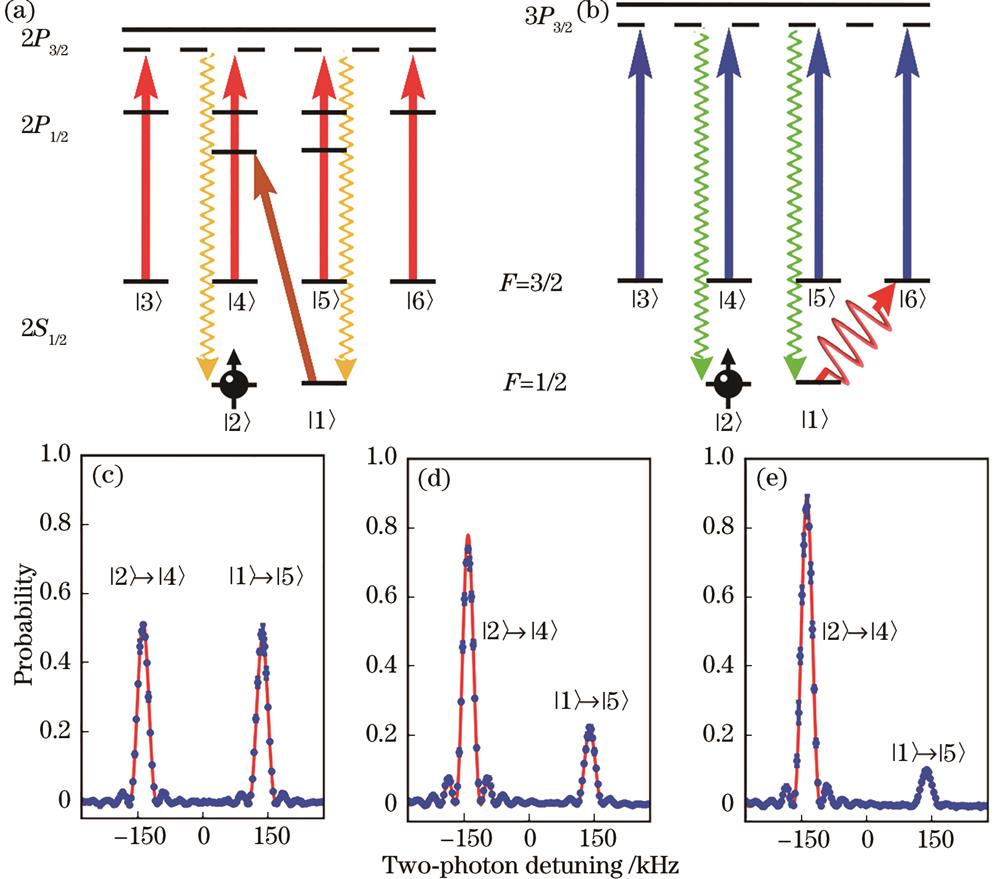
Fig. 2. Schematic diagrams and results of the state preparation for 6Li atoms. (a)(b) The schematic diagrams of state preparation by pure optical and combination with laser and radio frequency, respectively; (c)(d)(e) the atom distribution before state preparation, after state preparation by pure optical and combination with laser and radio frequency
Fig. 3. The optical path and energy level diagram of Raman beams in atom interferometer, and space-time trajectories of atoms in Ramsey-Bordé interferometers. (a) The σ+-π polarized crossed Raman beams,HWP and QWP are half wave plates and quarter wave plates, respectively, and PMT is a photomultiplier tube; (b) the energy levels and optical frequencies involved in magnetic insensitive Raman transitions; (c) the space-time trajectories of atoms in the up interferometry that ignores gravity; (d) the space-time trajectories of atoms in the low interferometry that ignores gravity, the solid and dashed lines represent the
Fig. 4. Interference signal of the 6Li atom interferometer. (a)-(d) The probability of the detecting of
|
Table 1. Relative uncertainty budgets for the measurement


Set citation alerts for the article
Please enter your email address

© Copyright 2018-2021 | Chinese Laser Press. All Rights Reserved 沪ICP备15018463号-20