• Laser & Optoelectronics Progress
  • Vol. 62, Issue 3, 0328001 (2025)
Xiangnan Zhu1,*, Zongming Tao2,3, and Qi Hao1
Author Affiliations
  • 1Key Laboratory of Quantum Materials and Devices, Ministry of Education, School of Physics, Southeast University, Nanjing 211189, Jiangsu , China
  • 2Jianghuai Advanced Technology Center, Hefei 230031, Anhui , China
  • 3Department of Basic Sciences, PLA Army Academy of Artillery and Air Defense, Hefei 230031, Anhui , China
  • show less
    DOI: 10.3788/LOP240942 Cite this Article Set citation alerts
    Xiangnan Zhu, Zongming Tao, Qi Hao. Simulation of Detection and Recognition for Aircraft Wake Vortices in Upper Airspace[J]. Laser & Optoelectronics Progress, 2025, 62(3): 0328001 Copy Citation Text show less
    Schematic diagram of aircraft wake vortices field velocity distribution
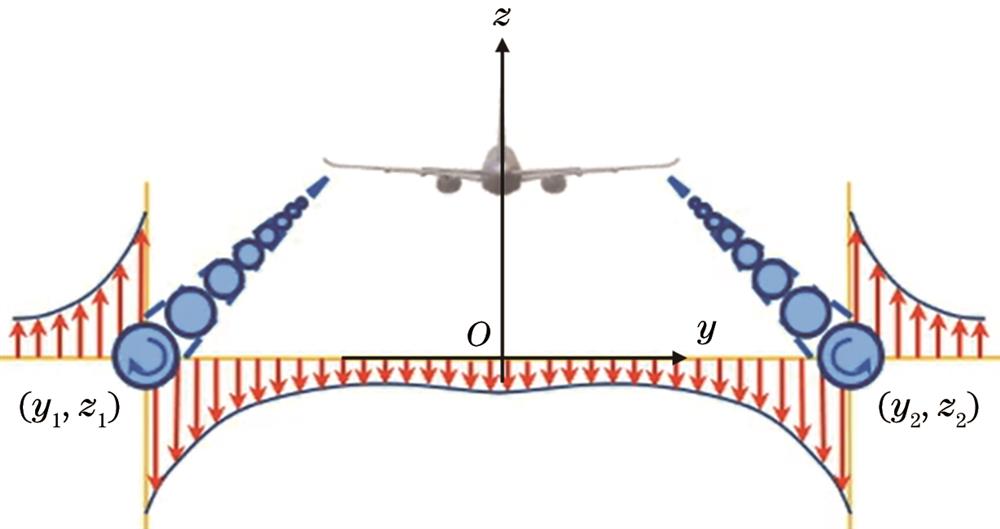
    Fig. 1. Schematic diagram of aircraft wake vortices field velocity distribution
    Schematic diagram of radial speed calculation
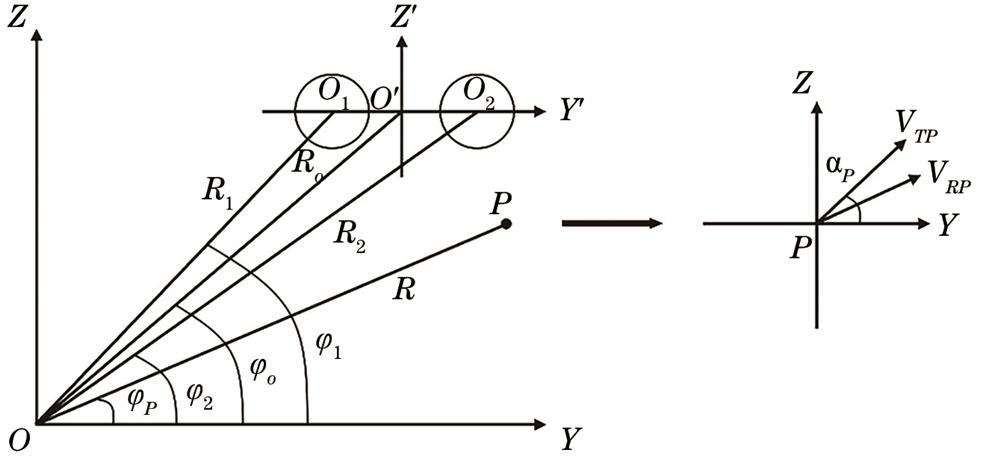
    Fig. 2. Schematic diagram of radial speed calculation
    Using Doppler spectrum to obtain velocity envelope. (a) Doppler spectrum; (b) schematic diagram of positive and negative velocity envelopes
    Fig. 3. Using Doppler spectrum to obtain velocity envelope. (a) Doppler spectrum; (b) schematic diagram of positive and negative velocity envelopes
    Schematic diagram of wake vortices circulation calculation
    Fig. 4. Schematic diagram of wake vortices circulation calculation
    Distribution of tangential velocity of a single wake vortex with distance. (a) Left; (b) right
    Fig. 5. Distribution of tangential velocity of a single wake vortex with distance. (a) Left; (b) right
    Velocity distribution diagram of wake vortices field in YOZ section. (a) P2P model; (b) CFD calculation
    Fig. 6. Velocity distribution diagram of wake vortices field in YOZ section. (a) P2P model; (b) CFD calculation
    Wake vortex dissipation process. (a) Typical wake vortex intensity dissipation process curve; (b) position distribution curve of vortex core of wake vortex in space
    Fig. 7. Wake vortex dissipation process. (a) Typical wake vortex intensity dissipation process curve; (b) position distribution curve of vortex core of wake vortex in space
    Variations of wake vortices circulation with altitude. (a) Flight speed is fixed at 1000 km/h; (b) flight speed increases linearly with altitude
    Fig. 8. Variations of wake vortices circulation with altitude. (a) Flight speed is fixed at 1000 km/h; (b) flight speed increases linearly with altitude
    Horizontal distribution of maximum tangential velocity and spatial distribution of core position of wake vortex at different altitudes.(a) Horizontal distribution of maximum tangential velocity; (b) spatial distribution of core position
    Fig. 9. Horizontal distribution of maximum tangential velocity and spatial distribution of core position of wake vortex at different altitudes.(a) Horizontal distribution of maximum tangential velocity; (b) spatial distribution of core position
    Comparison of actual observations and model calculations of wake vortex: (a) Dissipation over time; (b) subsidence over time
    Fig. 10. Comparison of actual observations and model calculations of wake vortex: (a) Dissipation over time; (b) subsidence over time
    ParameterValue
    Aircraft wingspan /m60.3
    Aircraft mass /kg1.8×105
    Vacuum speed /(km/h)800
    Atmospheric density /(kg/m30.4135
    Eddy current dissipation rate /(m2/s34.28×10-7
    B-V (Brunt-Väisälä) frequency /Hz0.023
    Effective viscosity factor during diffusion stage0.002
    Table 1. Related parameters of Airbus A330-200 model
    ParameterValue
    F-type wingspan /m13.57
    F-type mass /kg30206
    Su-type wingspan /m14.70
    Su-type mass /kg24900
    Eddy current dissipation rate /(m2/s34.28×10-7
    B-V frequency /Hz0.023
    Effective viscosity factor during diffusion stage0.002
    Table 2. Relevant parameters for simulation calculations